Overview
This article is part of a series:
...
This article series will focus on taking a simple command line script and incorporating it into Uptime Infrastructure Monitor. It will then demonstrate how to expand that script for use within a Custom with Retained Data service monitor that will enable you to not only register service outages in the event of a failure but also graph the historical performance trends. The final article in this series will guide you through the steps to further expand your custom service monitor so that it can be directly plugged in to the Uptime Infrastructure Monitor interface for use by your end users.
How Custom Service Monitors Work
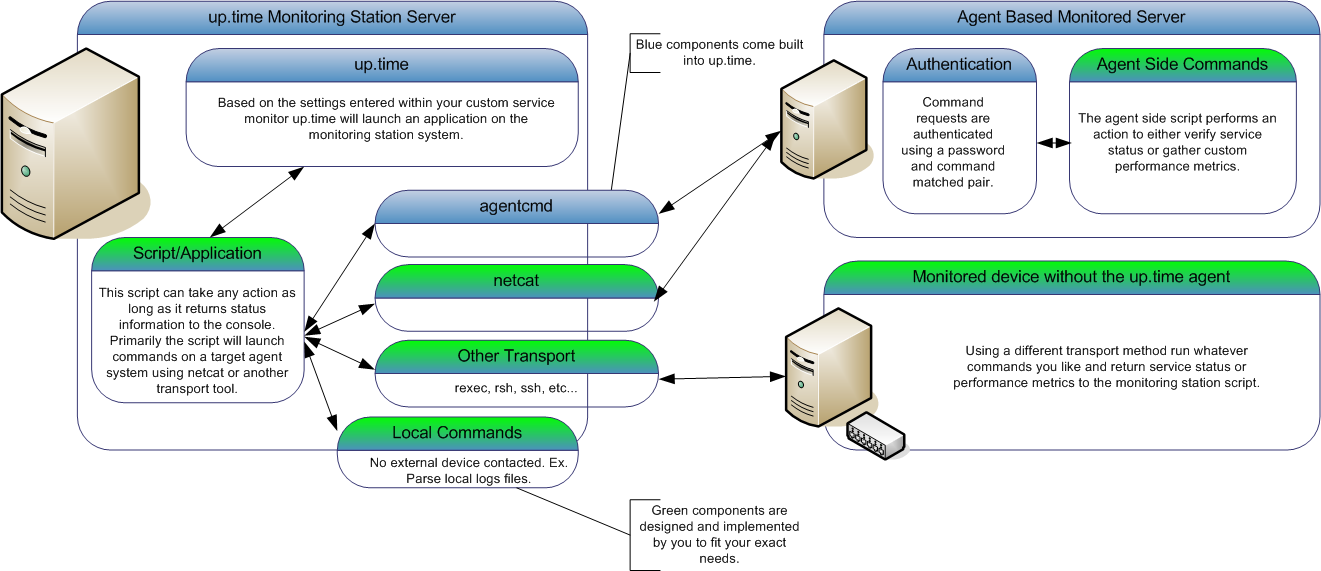
In Uptime Infrastructure Monitor, you can configure custom service monitors to run any application or script. The application or script can then take an action, including launching commands on one of your agent systems using a built-in agent authentication protocol. Or, your script can use a different transport method to contact other servers and applications, or simple run commands on the monitoring station itself. The only limitation is that the application or script must return status information that Uptime Infrastructure Monitor will then use to determine the custom service monitor status.
The built-in agent authentication protocol provides a quick and easy way for you to have the Uptime Infrastructure Monitor agent run commands (or any application) on your agent-side system without the fear of unknown users being able to execute the same commands. The output from the agent-side commands will be returned to the monitoring station custom script for parsing. This enables you to create a script that can monitor many different agent systems without duplicating the script many times. The following diagram illustrates the custom service monitor process:
Step 1 - Creating the Agent Side Script
When designing a custom service monitor, you should consider what information that you want the monitor to collect. For example:
...
| Code Block | ||
|---|---|---|
| ||
[HKEY_LOCAL_MACHINE\SOFTWARE\uptime software\up.time agent] "CmdsTimeout"=dword:00000014 "Port"=dword:0000270e "MaxClients"=dword:00000005 "Debug"=dword:00000000 "CmdsPassword"="secretpassword" "LogFile"="log.txt" [HKEY_LOCAL_MACHINE\SOFTWARE\uptime software\up.time agent\rexec_commands] "dir"= cmd.exe /c "dir c:" "show-temp"= cmd.exe /c "C:\scripts\show_temp.pl" |
Step 2 - Creating the Monitoring Station Script
The next step is to write the monitoring station script that will attempt to execute your agent side script, validate the output, and then return status or performance information to Uptime Infrastructure Monitor.
...
| Code Block | ||
|---|---|---|
| ||
# now lets check our values to see if they are over the thresholds and set our status message RET="OK - $msg is $VALUE on $AGENT" if [ $VALUE -ge "$WNG" ] then # this is our warning message # include WARNING for use in the web interface thresholds RET="WARNING - $MSG is $VALUE on $AGENT" fi if [ $VALUE -ge "$CRIT" ] then # this is our critical message # include CRITICAL for use in the web interface thresholds echo "CRITICAL - $MSG is $VALUE on $AGENT" fi # here we simply print our status message to the console and exit with a 0, # the thresholds provided in the up.time web interface will be used to set the monitor status rm $TMPFILE echo "$RET" exit 0 |
Step 3 - Adding your Custom Service Monitor to Uptime Infrastructure Monitor
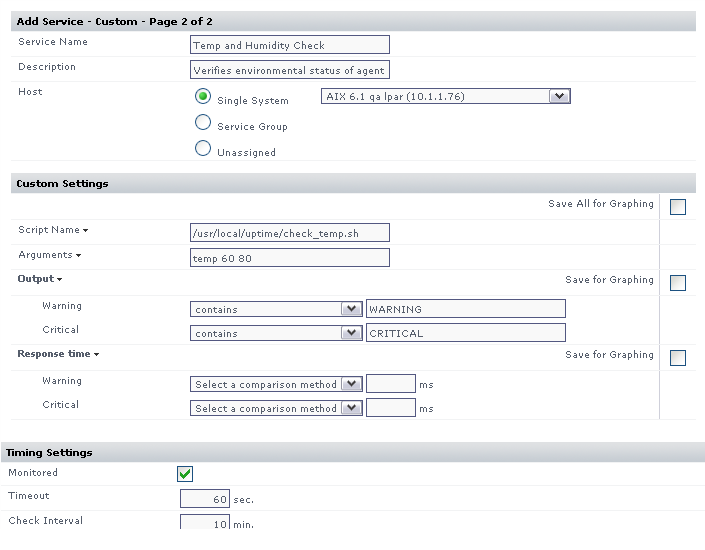
The next step is to add a custom service monitor to the Uptime Infrastructure Monitor Web interface using the same process that you would use to add a standard custom service monitor to Uptime Infrastructure Monitor. The Custom monitor option is found in the List Other Monitors section of the Add New Service Instance page.
...
The image below illustrates a sample monitor configuration. This service monitor will indicate a WARN or CRIT whenever the monitoring station custom script returns WARNING or CRITICAL in its output.