The following describes how to define and package a plugin that is fully compliant with The Grid, and Uptime Infrastructure Monitor's Extension Manager. Creating a compliant plugin ensures it is correctly categorized, and can be installed as seamlessly as possible from within Uptime Infrastructure Monitor. A plugin has the following guidelines:
- the main distributable is in .ZIP format
- the plugin scripts and other contents are structured in subdirectories:
/files: contains all files commonly used across different platforms (required)/files-posix: contains Linux-specific files (optional)/files-win: contains Windows-specific files (optional)
- an XML file at the root of the distributable that defines the plugin
Be sure to check out the following series of topics that help you create unique service monitors in Uptime Infrastructure Monitor:
- Creating Custom Service Monitors in Uptime Infrastructure Monitor
- Creating Custom Service Monitors with Retained Data Collection
- Creating Plugin Service Monitors in Uptime Infrastructure Monitor
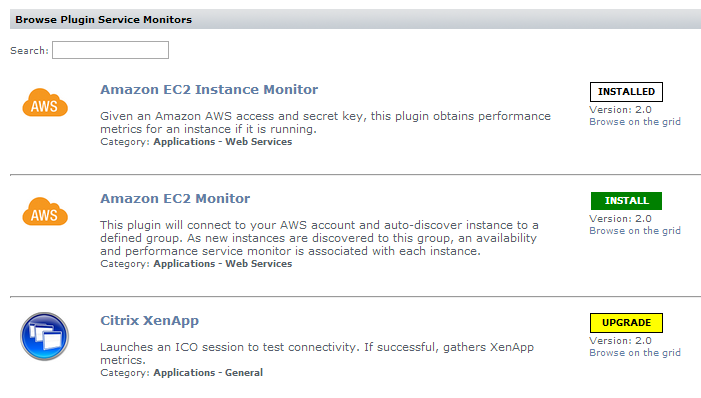
Extension Manager: Seamless Plugin and Gadget Management
Extension Manager allows you to browse and manage Grid-hosted plugin monitors and dashboard gadgets from within the Uptime Infrastructure Monitor Web interface. You can seamlessly check for updates, and install new plugins or updates without requiring the installation of the Plugin Manager.
Understanding the Plugin's XML Definition
A plugin's XML definition performs several key tasks:
- provides metadata for the plugin for categorization and management in Uptime Infrastructure Monitor's Extension Manager and Add Service Monitor page
- indicates the core script and auxiliary files that are required to run the plugin monitor
- defines the input fields on the plugin's configuration page that allow users to pass data to the plugin when it is run
- defines the output that the plugin returns to Uptime Infrastructure Monitor (to be included in alert messages, or for retention in the DataStore for graphing and reporting), and allows users to define comparative criteria for returned output that triggers alerts
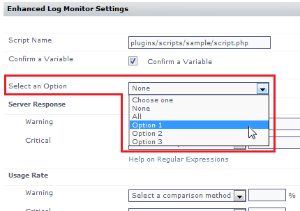
Each input or output field on the plugin's configuration page is built from instances of <element>, which is a child element of <elements>. The following is an example of an XML definition that includes three input fields and three output fields.
| Plugin XML Definition | |
|---|---|
|
|
| Plugin Input Settings Definition | |
|---|---|
|
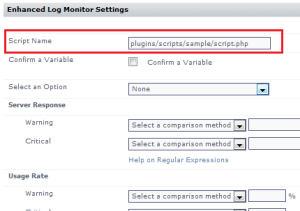
This first input element is a mandatory input field that accepts a string value, denoting a script name that will be executed by the plugin. |
|
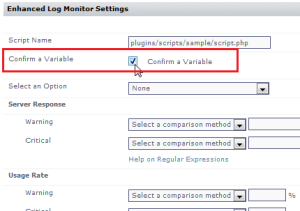
The second input element is a check box that passes a Boolean to the executed script. |
|
The third input element is a drop-down that passes one of several string-based options to the executed script. |
| Plugin Outputs Settings Definition | |
|---|---|
|
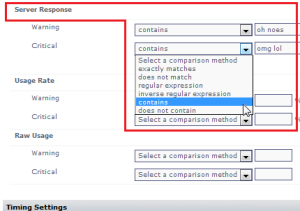
For the first output element, the plugin accepts a string value that will be compared against output from the executed script. The string data type determines the comparative options to determine warning and critical conditions. |
|
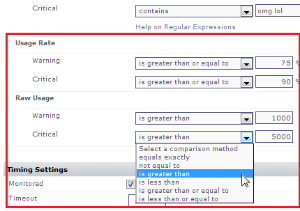
The next two output elements are similar enough to be paired on the configuration screen using <group> as a parent element. The name attribute is the grouping label in the user interface. The units attribute adds a label after the field to assist the user. The first of the two elements accepts integer values and compares them to integer values returned through the script. The second of the two elements accepts decimal values and compares them to a range of values returned through the script. |
Definition XML Reference
The following table summarizes valid values for the various XML elements, child elements, and attributes that define a plugin.
| Child element of <elements> | Description |
|---|---|
element hidden | Determines whether the plugin is hidden in the Uptime Infrastructure Monitor interface. Enabling this allows you to create hidden plugins. optional; default false |
class | The name of the plugin as displayed in the Uptime Infrastructure Monitor interface (for example, the Add Service Monitor page). |
exec | References to any support classes that are required to run the plugin. |
erdc_version | The version scheme supported is 0.0 (major and minor version). A minor-minor version (for example, 1.2.1) is not processed. |
category | The main category this plugin belongs to. This will help others find the plugin on the Grid, and this is where the plugin will be listed on the Add Monitors page.
|
category_related | Other categories the plugin is related to, separated by commas. |
grid_info | This element wraps child elements that describe the plugin specifically for the Grid. |
| Child element of <grid_info> | Description |
|---|---|
supported_versions | The versions of the Uptime Infrastructure Monitor Monitoring Station supported by this plugin. The version scheme supported must match Uptime Infrastructure Monitor releases (in 0.0 format), and it needs to be a comma-separated list of every version supported. |
supported_platforms | possible values:
|
requires_agent_scripts | If "true," indicates that the administrator is also going to have to install or deploy agent-side scripts as a follow-up step to installing the plugin on the Monitoring Station. If this is enabled, the user will see a related message on the Extension Manager, directing them to the plugin's Grid page for more information. optional; default false |
upgrade_in_place | If "true," indicates this version will overwrite previous versions of the plugin as part of an automatic upgrade. optional; default false |
help | Help text for the plugin that is displayed when the user screams "help!" as loud as they can. lol j/k – it's what appears as a tool tip for the plugin on the Add Service Monitor page. |
elements | Describes what the plugin processes and inputs and outputs, and how these are presented to, and configured by, Uptime Infrastructure Monitor users. |
| Attributes of <elements> | Description |
|---|---|
name | The label of the input or output field in the Uptime Infrastructure Monitor interface, during plugin configuration. |
parameter_type | Determines whether this child element is taking data from the Uptime Infrastructure Monitor user and passing it to the plugin script, or taking data output by the plugin script for use in Uptime Infrastructure Monitor. Possible values:
|
data_type | The expected data type that will be sent to, or returned by, the plugin script.
|
gui_basic | Determines whether the element appears in a standard or advanced view in the configuration screen. default enabled (1) |
range_type | default is disabled (0) |
units | adds a label in the GUI to help the user determine what to input |
| Child elements of <element> | Description |
|---|---|
control_options | Determines the size of the text input field during plugin configuration. |
default_value | Populates the field with a default value. |
short_description | The name of the configuration field in the Uptime Infrastructure Monitor interface. |
long_description | The description that appears as a tool tip. |
validation_rule | Optionally use a child element (for example, <integer/> or <alphanumeric/>) to indicate how to validate the input data. |
error_message | Message provided to the user if the validation rule fails. |
gui_type | Indicates how the element is presented and configured in the UI. Use one of the following child elements:
The single_select child element uses a type attribute (for example, dropdown or radio) that indicates the type of GUI selection widget that will be used. A value child element then defines each of the selector options. For example: <gui_type> |
Formatting your monitoring station script for retained data tracking
To format your custom script for use with a plug-in monitor, you will only need to make changes to the way that it outputs information when the script is run. Instead of printing a number to screen on individual lines, such as the Custom with Retained Data, you must also print a variable name along with the numerical or string value. Choosing a variable name is the most important part of setting up the plug-in monitor. The variable name must be exactly the same within your script output and the XML definition for your service monitor. This is discussed later in this article.
The format of plug-in monitor output is included below along with an example set of output that includes two integer variables (transactions and users) and two string values (lasterror and connectmsg). The output format is a simple name and value pairing, the variable naming coming first on a line and the value for that variable following it.
Expected format:
variable value
variableX valueX
Example script execution and output:
> gather_data.sh
 transactions 2398
 users 5
 lasterror Error opening user connection!
 connectmsg Connection refused
Creating the XML definition for your plug-in service monitor
To integrate the plug-in monitor with Uptime Infrastructure Monitor, you must produce an XML definition that Uptime Infrastructure Monitor will use to understand how to process your custom script and what options should be displayed within the Uptime Infrastructure Monitor interface. To create your XML definition, browse to the Plug-in Service Monitor XML Generation Tool and follow the steps on screen.
This page will be your primary tool to create and edit your XML definition files. If you want to further customize the XML definition of your plug-in monitor, please contact [email protected] for assistance. Before you use the XML Generation Tool, have the following information about your plug-in monitor available:
- The name of your monitor, which will appear in the Uptime Infrastructure Monitor services list. This name must be unique.
- The full path to your custom script
- For each variable that your script produces:
- Var Name: this must match the output variable name and be only one word.
- Title: for instance if your variable was named 'temp' an appropriate title may be 'Temperature'
- Description: Full description of the variable.
- Unit: if the variable should have a unit associated with it for graphing
- Type: Either String or Decimal based on the value for your variable.
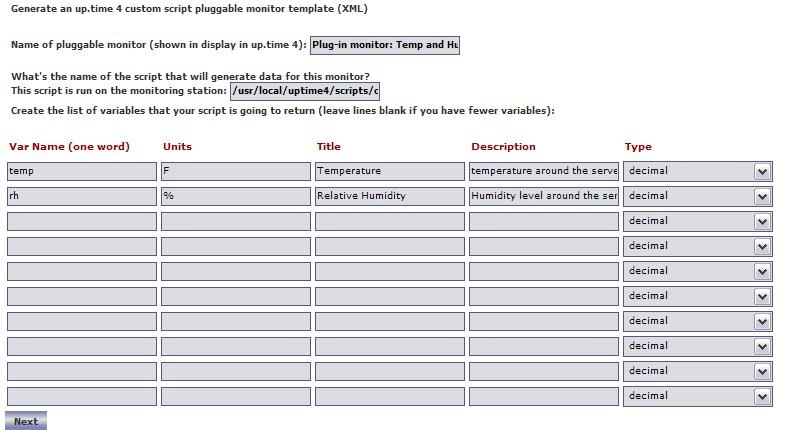
Once you have generated your XML file, save it to your monitoring station in the UPTIME_DIRxml folder and continue to the next step. Below is an example screen shot of the options used to create an XML definition for the check_temp.sh script. The XML file that these options produce is attached to this article.
Example options used to produce XML for check_temp.sh.
Importing and managing your XML plug-in monitor definition
Now that you have both the XML definition for your custom script and your custom script in place, you can import your plug-in monitor into Uptime Infrastructure Monitor. You use the erdcloader and erdcdeleter to import and export your plug-in monitor. Examples of the options for these commands are included below.
The UPTIME_DIR/scripts/erdcloader utility is used to import your plug-in monitor XML definition as a service monitor template within Uptime Infrastructure Monitor.
| Option Name | Description |
|---|---|
| -c | Changes the default launch configuration file |
| -h, --help | Prints help information |
| -x, --xml | Defines the XML file to load to create your plug-in monitor template. |
Example Execution:> cd UPTIME_DIR
> scripts/erdcloader -x MyMonitor.xml
The UPTIME_DIR/scripts/erdcdeleter utility is used to remove your plug-in monitor template from Uptime Infrastructure Monitor.
| Option Name | Description |
|---|---|
| -l, --list | Lists all service monitor templates that can be removed from Uptime Infrastructure Monitor |
| -h, --help | Prints help information |
| -n, --name | Deletes the service monitor template with the given name. A template must have no service monitors currently using it in order to be deleted. |
Example Execution:
> cd UPTIME_DIR
 > scripts/erdcdeleter --list
 .
 .
 .
 My test monitor template
> scripts/erdcdeleter --name "My test monitor template"
While working with your XML definition and ensuring that your service monitor works correctly, you will probably run each of these commands a number of times. Below is a quick example of the output expected when importing the check_temp.xml template using the erdcloader utility.
> cd UPTIME_DIR
> ls scripts/check_temp.sh
scripts/check_temp.sh
> ls xml/check_temp.xml
xml/check_temp.xml
> scripts/erdcloader -x xml/check_temp.xml
2006-05-12 17:09:03,376 DEBUG (HibernateManager:178) - Configuring database for: mysql
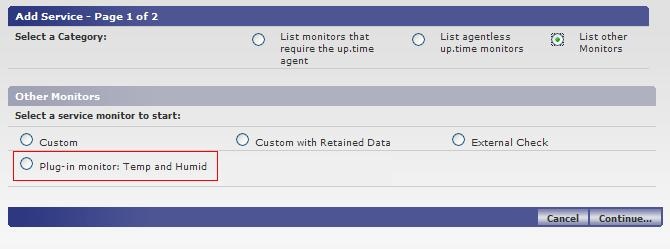
2006-05-12 17:09:08,743 DEBUG (ERDCXmlParser:56) - Plug-in monitor: Temp and Humid
Now that the plug-in monitor has been imported, you can browse to the Add Service Instance page in the Uptime Infrastructure Monitor user interface and see the plug-in monitor listed, as shown below: