Overview
This article is part of a series:
- Part 1 - Creating Custom Service Monitors in Uptime Infrastructure Monitor
- Part 2 - Creating Custom Service Monitors with Retained Data Collection
- Part 3 - Creating Plugin Service Monitors in Uptime Infrastructure Monitor
...
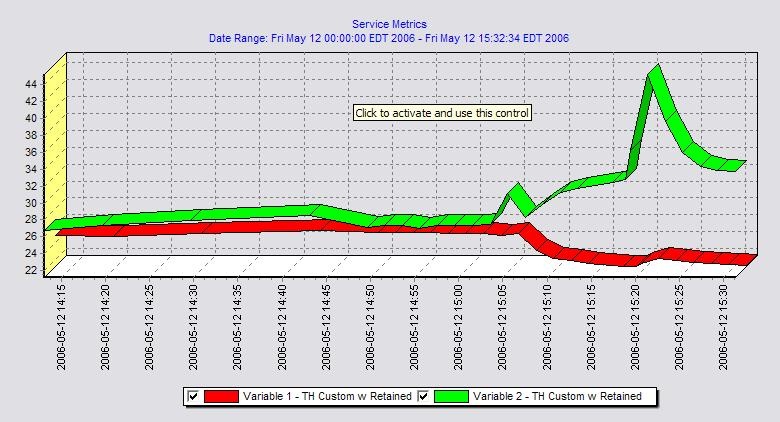
Example graph produced using a custom service monitor with retained data.
...
Formatting your monitoring station script for retained data tracking
To use a custom script with retained data with Uptime Infrastructure Monitor, you must change the output format produced by your script. All of the rules found in a regular custom service monitor still apply with a few slight modifications, as detailed below:
- The monitoring station script must return a single number (decimal or integer) per line -- one line for each metric that you want to Uptime Infrastructure Monitor to retain. You can have a maximum of 10 lines retained. The example script output shown below retains the values '10.5' and '99' as two distinct graphable trends within Uptime Infrastructure Monitor:
> check_temp.sh
10.5
99 - The output must be in numeric format; you cannot have text output. This enables the service monitor to perform all threshold checking within Uptime Infrastructure Monitor instead of having your script determine thresholds and return an outage message in text format.
- The script must exit with a success status (0), unless there has been a problem when the script is run or if you want to force a status for the service monitor.
- The script must accept the hostname of the agent system as the first argument. Uptime Infrastructure Monitor will automatically add this argument to the arguments passed to your script.
- In general, you do not need to change to your existing agent side script or configuration in order for your service monitor to retain performance metrics.
...
Changing the check_temp script for retained data
Using the check_temp.sh script as a basis for this example, you can easily change the script to fit within the context of a custom service monitor with retained data. To do this, you must make the following changes to the script:
...
| Code Block | ||
|---|---|---|
| ||
# we have the output from the agent. If it is ERR that means there was a problem running the script on the agent
`grep ERR $TMPFILE`
if [ $? -eq 0 ]
then
echo "Could not execute agent side script!"
# by exiting with a 2 we are forcing a CRIT service outage
exit 2
fi

# in this script we don't need to check thresholds or determine which information to check
# we just need to reformat the agent side script output slightly so that only numerical info is displayed
# we do this by trimming off the first word returned on each line from the agent, leaving just the numbers
# and printing that to screen, Uptime Infrastructure Monitor will handle the rest

awk '{print $2}' $TMPFILE

exit 0 |
...
Adding Custom Service Monitor with Retained Data to Uptime Infrastructure Monitor
Next, add your custom service monitor with retained performance metrics to the Uptime Infrastructure Monitor Web interface using the same process that you would use to add a standard custom service monitor to Uptime Infrastructure Monitor. The Custom with Retained Data monitor option is found in the List Other Monitors section of the Add New Service Instance page.
...
- Enter a name and description for the monitor.
- Select a host from the dropdown menu. Be sure to select the same host that your agent side script is on
- In the Script Name field, enter the path to the custom script on your monitoring station. On Windows systems be sure to use UNIX style / instead of and put quotation marks around your path. For example: "C:/my files/check_temp.bat
- In the Arguments field, enter the arguments for the script. Uptime Infrastructure Monitor adds the agent name as the first argument automatically so do not include it.
- Select contains from the Warning dropdown and enter
WARNINGas the search text. - Select contains from the Critical drop down and enter
CRITICALas the search text. - Complete the remainder of the monitor template as you would for a normal service monitor.
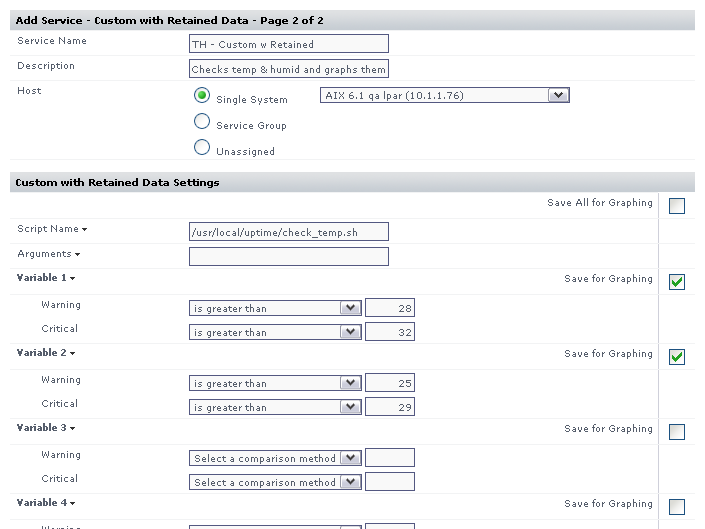
Example monitor configuration
The image below illustrates a sample monitor configuration. This service monitor will indicate a WARN or CRIT whenever the monitoring station custom script returns WARNING or CRITICAL in its output.