Overview
This article is part of a series:
- Part 1 - Creating Custom Service Monitors in Uptime Infrastructure Monitor
- Part 2 - Creating Custom Service Monitors with Retained Data Collection
- Part 3 - Creating Plugin Service Monitors in Uptime Infrastructure Monitor
...
The process of updating your existing scripts and service monitors to be plug-in monitors can usually be completed in just a few minutes. This article builds on the scripts and knowledge that were developed in previous articles. Take some time to review the previous articles before continuing.
...
Formatting your monitoring station script for retained data tracking
To format your custom script for use with a plug-in monitor, you will only need to make changes to the way that it outputs information when the script is run. Instead of printing a number to screen on individual lines -- like the Custom with Retained Data -- you must also print a variable name along with the numerical or string value. Choosing a variable name is the most important part of setting up the plug-in monitor. The variable name must be exactly the same within your script output and the XML definition for your service monitor. This is discussed later in this article.
...
Example Script Execution and Output:
> gather_data.sh
transactions 2398
users 5
lasterror Error opening user connection!
connectmsg Connection refused
...
Changing the check_temp script for use within a plug-in service monitor
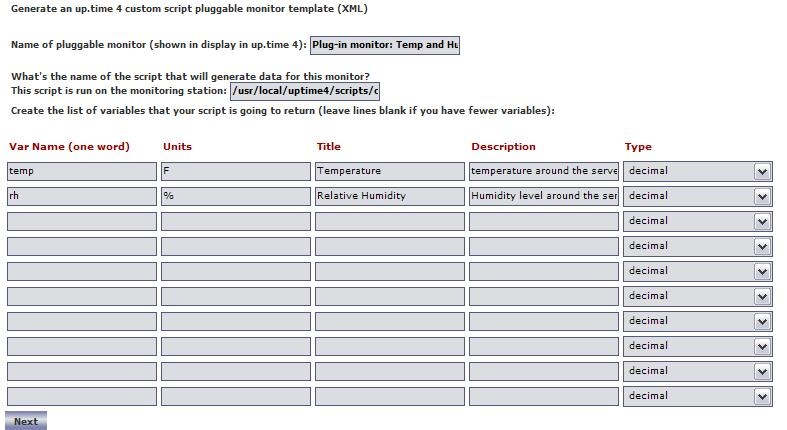
Using the check_temp.sh script as an example, change the output format so that it can be used within a plug-in monitor. You must first decide what to call the variables that the script will output. Currently, the script outputs temperature and relative humidity -- name the two variables temp and rh.
...
| Code Block | ||
|---|---|---|
| ||
# we have the output from the agent. If it is ERR that means there was a problem running the script on the agent `grep ERR $TMPFILE` if [ $? -eq 0 ] then echo "Could not execute agent side script!" # by exiting with a 2 we are forcing a CRIT service outage exit 2 fi # because our agent side script produces output that fits into the plug-in monitor format # we don't have to format our output at all, simply print it to the screen and we are finished. cat $TMPFILE exit 0 |
...
Creating the XML definition for your plug-in service monitor
To integrate the plug-in monitor with Uptime Infrastructure Monitor, you must produce an XML definition that Uptime Infrastructure Monitor will use to understand how to process your custom script and what options should be displayed within the Uptime Infrastructure Monitor interface. To create your XML definition browse to the Plug-in Service Monitor XML Generation Tool and follow the steps on screen.
...
Example options used to produce XML for check_temp.sh.
...
Importing and managing your XML plug-in monitor definition
Now that you have both the XML definition for your custom script and your custom script in place, you can import your plug-in monitor into Uptime Infrastructure Monitor. You use the erdcloader and erdcdeleter to import and export your plug-in monitor. Examples of the options for these commands are included below.
...
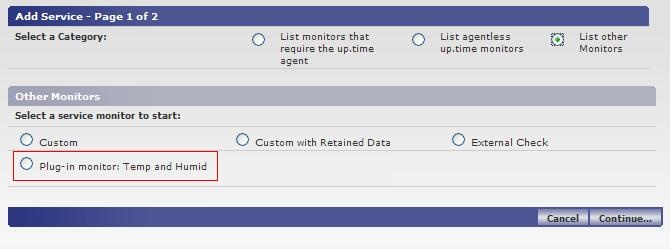
Now that the plug-in monitor has been imported, you can browse to the Add Service Instance page in the Uptime Infrastructure Monitor user interface and see the plug-in monitor listed, as shown below:
...
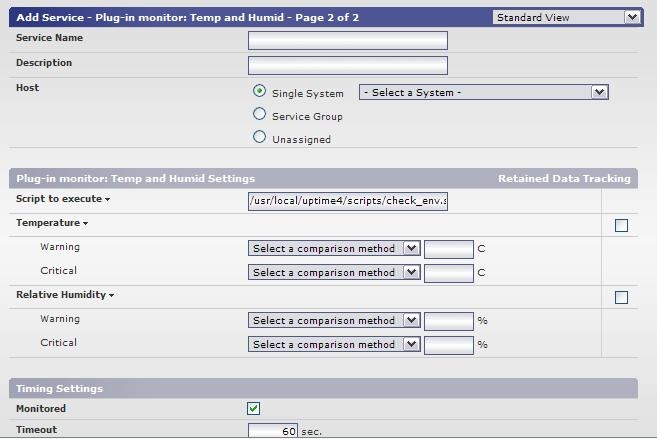
Adding Instances of your plug-in service monitor
To add an instance of your plug-in service monitor, browse to the Add Service Instance list, select your plug-in service monitor, and click Continue. The options displayed on the monitor template match the definition that you created with the XML generation tool. The service monitor settings that would appear based on the example XML definition are shown below: