...
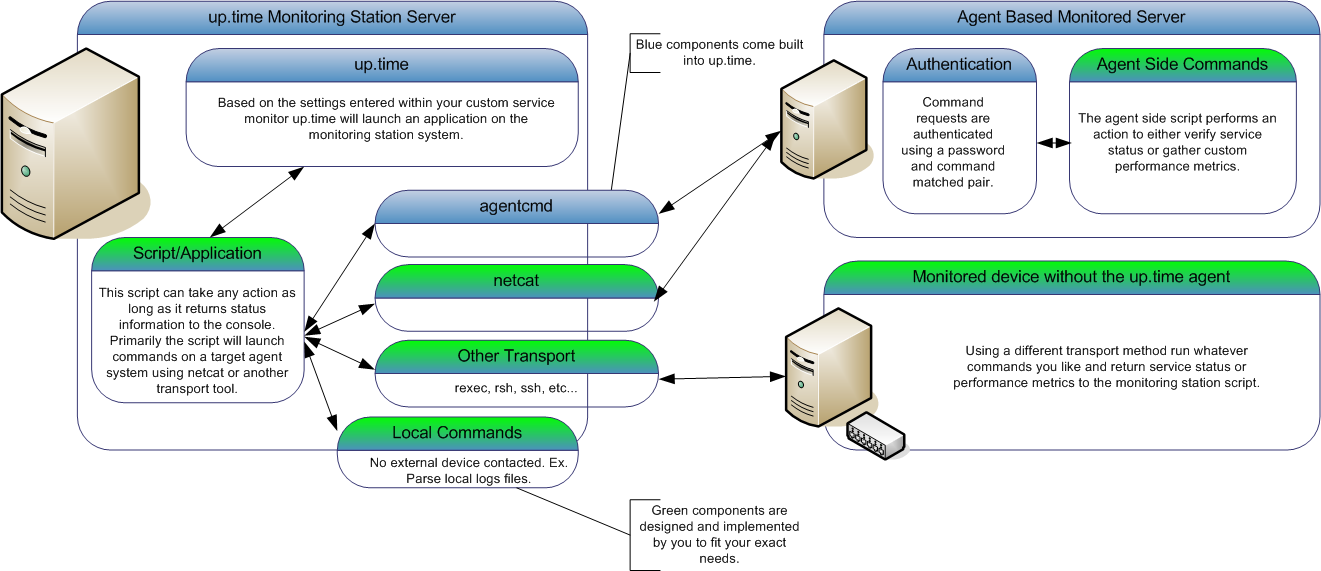
The built-in agent authentication protocol provides a quick and easy way for you to have the Uptime Infrastructure Monitor agent run commands (or any application) on your agent-side system without the fear of unknown users being able to execute the same commands. The output from the agent-side commands will be returned to the monitoring station custom script for parsing. This enables you to create a script that can monitor many different agent systems without duplicating the script many times. The following diagram illustrates the custom service monitor process:
...
Step 1 - Creating the Agent Side Script
...
- To get started with custom scripts, or for implementations with only a handful of custom monitor instances, use agentcmd. The agentcmd utility is commonly called in the format listed below to execute a command on the agent side system. Please note that this utility is a helper tool, if you are using many custom monitor instances we recommend using an alternate tool.
This example uses the settings that were configured above to execute the agent side script:Format:
Code Block /usr/local/uptime/scripts/agentcmd [-s/+s] -p [agent port] [agent hostname] rexec [password] [path]
Example:
Code Block /usr/local/uptime/scripts/agentcmd -p 9998 my-agent rexec secretpassword /opt/uptime-agent/my-scripts/show_temp.sh my-arguments
For more information, click on Using the agentcmd Utility.
- If you plan on implementing a number of custom monitor instances, use netcat. netcat must be downloaded and installed on the monitoring station if it isn't already installed as part of your operating system. The netcat utility is commonly called in the format listed below to execute a command on the agent side system. This example uses the settings that were configured above to execute the agent side script:
Format:
Code Block echo -n rexec [password] [path] | /usr/local/uptime/bin/netcat [agent hostname] [agent port]
Example:
Code Block echo -n rexec secretpassword /opt/uptime-agent/my-scripts/show_temp.sh my-arguments | /usr/local/uptime/bin/netcat my-agent 9998
| Note | ||
|---|---|---|
|
...
The 'rexec' text below does not indicate use of the 'rexec' system utility |
...
; it is simply a key word used to indicate to the agent that you are attempting to run a predefined command. |
You will normally use netcat or agentcmd in the monitoring station script to return the results of an agent-side script, validate the status of those results, and return the status to Uptime Infrastructure Monitor. The following is an example of a monitoring station script:
...
| Code Block |
|---|
#!/bin/sh |
...
# This script takes the following arguments: |
...
# check_temp.sh hostname port [temp|rh] wng crit |
...
# Example execution: |
...
# ./check_temp.sh my-agent 9998 temp 60 80 |
...
# ./check_temp.sh my-agent 9998 rh 20 30 |
...
# This script can be placed anywhere on the monitoring station system as long as it is |
...
# executable by the uptime user. |
...
#First, collect our arguments |
...
AGENT=$1 |
...
PORT=$2 |
...
TYPE=$3 |
...
WNG=$4 |
...
CRIT=$5 |
...
TMPFILE=/tmp/$$.temp |
...
# now use the info above to contact our agent, store the output in a file for parsing
# now use the info above to contact our agent, store the output in a file for parsing
...
| Code Block |
|---|
`echo -n rexec secretpassword /opt/uptime-agent/my-scripts/show_temp.sh my-arguments | /usr/local/uptime4/bin/netcat $AGENT $PORT > $TMPFILE` |
| Note |
|---|
...
|
...
The syntax to use agentcmd is different than netcat. Review the following example. |
When using agentcmd, the above netcat example would look like this:
...
| Code Block |
|---|
'/usr/local/uptime/scripts/agentcmd my-agent -p 9998 rexec secretpassword /opt/uptime-agent/my-scripts/show_temp.sh my-arguments > $TMPFILE' |
...
| Code Block |
|---|
# we have the output from the agent. If it is ERR that means there was a problem running the script on the |
...
` grep ERR $TMPFILE`if [ $? - eq 0 ]thenecho "Could not execute agent side script!"# by exiting with a 2 we are forcing a CRIT service outageexit 2fi
# given our parameters we can now extract the correct value from the agent outputif [ $TYPE - eq "temp" ]thenVALUE=` head -1 $TMPFILE | awk '{print $2}' `MSG= "temperature"elseVALUE=` tail -1 $TMPFILE | awk '{print $2}' `MSG= "humidity"fi# now lets check our values to see if they are over the thresholds and set our status messageRET= "OK - $msg is $VALUE on $AGENT"if [ $VALUE - ge "$WNG" ]then# this is our warning message# include WARNING for use in the web interface thresholdsRET= "WARNING - $MSG is $VALUE on $AGENT"fiif [ $VALUE - ge "$CRIT" ]then# this is our critical message# include CRITICAL for use in the web interface thresholdsecho "CRITICAL - $MSG is $VALUE on $AGENT"fi# here we simply print our status message to the console and exit with a 0, # the thresholds provided in the up.time web interface will be used to set the monitor statusrm $TMPFILEecho "$RET" agent
`grep ERR $TMPFILE`
if [ $? -eq 0 ]
then
echo "Could not execute agent side script!"
# by exiting with a 2 we are forcing a CRIT service outage
exit 2
fi |
| Code Block |
|---|
# given our parameters we can now extract the correct value from the agent output
if [ $TYPE -eq "temp" ]
then
VALUE=`head -1 $TMPFILE | awk '{print $2}'`
MSG="temperature"
else
VALUE=`tail -1 $TMPFILE | awk '{print $2}'`
MSG="humidity"
fi |
| Code Block |
|---|
# now lets check our values to see if they are over the thresholds and set our status message
RET="OK - $msg is $VALUE on $AGENT"

if [ $VALUE -ge "$WNG" ]
then
# this is our warning message
# include WARNING for use in the web interface thresholds
RET="WARNING - $MSG is $VALUE on $AGENT"
fi
if [ $VALUE -ge "$CRIT" ]
then
# this is our critical message
# include CRITICAL for use in the web interface thresholds
echo "CRITICAL - $MSG is $VALUE on $AGENT"
fi

# here we simply print our status message to the console and exit with a 0,
# the thresholds provided in the up.time web interface will be used to set the monitor status
rm $TMPFILE
echo "$RET"
exit |
...
0 |
...
Step 3 - Adding your Custom Service Monitor to Uptime Infrastructure Monitor
The next step is to add a custom service monitor to the Uptime Infrastructure Monitor Web interface using the same process that you would use to add a standard custom service monitor to Uptime Infrastructure Monitor. The Custom monitor option is found in the List Other Monitors section of the Add New Service Instance page
...
.
The Custom service monitor template has the following monitor specific settings available:
| Option Name | Description | Example |
|---|---|---|
| Script Name | The script name is the path to your monitoring station script, this is the script that Uptime Infrastructure Monitor will execute when running this service monitor. Be sure to use the complete path wherever possible and that the path is to a locally mounted volume. For Windows script paths you must use UNIX style directory separators (/ instead of \) and also place double quotes around the entire script name. | UNIX/Linux Example:
Windows Example: |
| Arguments | These are the arguments that you would like Uptime Infrastructure Monitor to pass into your monitoring station script. No arguments are required but please be aware that Uptime Infrastructure Monitor will automatically include the selected hostname as the first argument to your script. | temp 60 80 |
| Output Warning | This is the warning threshold used against the output returned from your monitoring station script. This is a textual comparison. You must select both a comparison method and a search string to enable the warning level threshold. | Output contains: "warning" |
| Output Critical | This is the critical threshold used against the output returned from your monitoring station script. This is a textual comparison. You must select both a comparison method and a search string to enable the critical level threshold. | Output contains: "critical" |
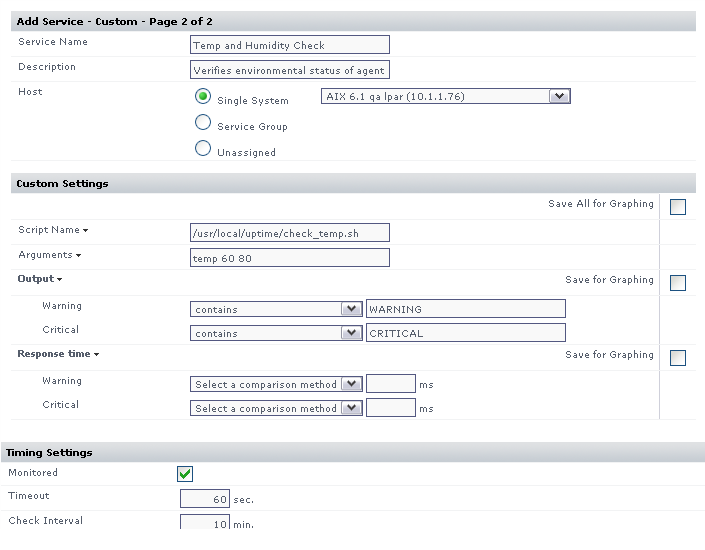
Based on the settings used in the example monitoring station script, configure the monitor with the following setting:
- Enter a name and description for the monitor.
- Select a host from the dropdown menu. Be sure to select the same host that your agent side script is on
- In the
Script Namefield, enter the path to the custom script on your monitoring station. On Windows systems be sure to use UNIX style / instead of \ and put quotation marks around your path. For example:"C:/my files/check_temp.bat" - In the
Argumentsfield, enter the arguments for the script. Uptime Infrastructure Monitor adds the agent name as the first argument automatically so do not include it. - Select
containsfrom theWarningdropdown and enterWARNINGas the search text. - Select
containsfrom theCriticaldrop down and enterCRITICALas the search text. - Complete the remainder of the monitor template as you would for a normal service monitor.
Example monitor configuration
The image below illustrates a sample monitor configuration. This service monitor will indicate a WARN or CRIT whenever the monitoring station custom script returns WARNING or CRITICAL in its output.