This article is part of a series:
- Part 1 - Creating Custom Service Monitors in Uptime Infrastructure Monitor
- Part 2 - Creating Custom Service Monitors with Retained Data Collection
- Part 3 - Creating Plugin Service Monitors in Uptime Infrastructure Monitor
Uptime Infrastructure Monitor provides many built in service monitors that allow you to monitor and alert on a wide array of services and applications within your enterprise. However, the standard Uptime Infrastructure Monitor service monitors may not be adequate to monitor all of the systems, applications and proprietary devices in your environment. In some cases, you may want to capture metrics that are unique to your environment. To do this, you can define custom service monitors to monitor custom services and applications to provide the level of in depth performance monitoring that you require. Using custom service monitors, you can monitor and graph historical performance data from just about any device in your environment.
...
Windows agents do not require a password file. However, you must enter the equivalent settings into the Agent Console with the following steps:
- Launch the Agent Console on the system where the script will run. By default this is located in the Start Menu under “All Programs -> Uptime agent -> Uptime Agent Console.”
- The first step after launching the Agent console is to set a password in the ‘Agent Options’ section and click save. This password will be used to authenticate with the agent before running the script.
- After setting the password, tell the agent where the custom script is located on the server by clicking on the ‘Advanced’ option in the dropdown list and selecting ‘Custom Scripts.’
- On the Custom Scripts screen, you should see an example similar to:
- Custom Command: dir
- Path to Script: cmd.exe /c "dir c:"
- To continue this show-temp example, set the parameters to something similar to:
- Custom Command: temp
- Path to Script: cmd.exe /c “C:scriptsshow_temp.pl” (note: make sure to click Add/Edit before closing the window, otherwise your command will not be saved).
- If you haven’t done so yet, click Save, and Yes when asked to restart the agent. This will ensure that your new settings take effect.
The following is a sample configuration. Note the additional folder named rexec_commands , which contains a key/value pair of the command key.
...
| Code Block |
|---|
[HKEY_LOCAL_MACHINE\SOFTWARE\uptime software\up.time agent] "CmdsTimeout"=dword:00000014 "Port"=dword:0000270e "MaxClients"=dword:00000005 "Debug"=dword:00000000 "CmdsPassword"="secretpassword" "LogFile"="log.txt" [HKEY_LOCAL_MACHINE\SOFTWARE\uptime software\up.time agent\rexec_commands] "dir"= cmd.exe /c "dir c:" "show-temp"= cmd.exe /c "C:\scripts\show_temp.pl" |
...
Step 2 - Creating the Monitoring Station Script
The next step is to write the monitoring station script that will attempt to execute your agent side script, validate the output, and then return status or performance information to Uptime Infrastructure Monitor.
...
- The script must return at least one line of output to the system console. Uptime Infrastructure Monitor will use this output to determine the status of the custom service monitor.
- The script must exit with a success status, unless there has been a problem during the execution of the script or you want to force a status for the service monitor. Acceptable return codes are:
- exit 0 - The script executed without any errors, all output produced from the script will be parsed by Uptime Infrastructure Monitor to determine the service monitor status.
- exit 1 - The service monitor status will be set to
WNG(warning) and an outage will be recorded. The console output from the script will be placed in the custom service monitor status message. - exit 2 - The service monitor status will be set to
CRIT(critical) and an outage will be recorded. The console output from the script will be placed in the custom service monitor status message.
- The script must accept the host name of the agent system as the first argument. Uptime Infrastructure Monitor will automatically add this argument to the arguments that are passed to the script.
In most cases, the monitoring station script will contact an agent system and attempt to run a predefined agent-side script like the one that was defined in step 1 above. You can use any transport tool -- such as rexec, rsh, or ssh -- to contact the agent system.
However, uptime software IDERA recommends using the bundled agentcmd utility the netcat utility to contact your agent systems from your monitoring station script:
- To get started with custom scripts, or for implementations with only a handful of custom monitor instances, use agentcmd. The agentcmd utility is commonly called in the format listed below to execute a command on the agent side system. Please note that this utility is a helper tool, if you are using many custom monitor instances we recommend using an alternate tool.
This example uses the settings that were configured above to execute the agent side script:Format:
Code Block /usr/local/uptime/scripts/agentcmd [-s/+s] -p [agent port] [agent hostname] rexec [password] [path]
Example:
Code Block /usr/local/uptime/scripts/agentcmd -p 9998 my-agent rexec secretpassword /opt/uptime-agent/my-scripts/show_temp.sh my-arguments
For more information, click on Using the agentcmd Utility.
...
# now lets check our values to see if they are over the thresholds and set our status messageRET= "OK - $msg is $VALUE on $AGENT"if [ $VALUE - ge "$WNG" ]then# this is our warning message# include WARNING for use in the web interface thresholdsRET= "WARNING - $MSG is $VALUE on $AGENT"fiif [ $VALUE - ge "$CRIT" ]then# this is our critical message# include CRITICAL for use in the web interface thresholdsecho "CRITICAL - $MSG is $VALUE on $AGENT"fi# here we simply print our status message to the console and exit with a 0, # the thresholds provided in the up.time web interface will be used to set the monitor statusrm $TMPFILEecho "$RET"exit 0Step 3 - Adding your Custom Service Monitor to Uptime Infrastructure Monitor
The next step is to add a custom service monitor to the Uptime Infrastructure Monitor Web interface using the same process that you would use to add a standard custom service monitor to Uptime Infrastructure Monitor. The Custom monitor option is found in the List Other Monitors section of the Add New Service Instance page..
The Custom service monitor template has the following monitor specific settings available:
| Option Name | Description | Example |
| Script Name | The script name is the path to your monitoring station script, this is the script that Uptime Infrastructure Monitor will execute when running this service monitor. Be sure to use the complete path wherever possible and that the path is to a locally mounted volume. For Windows script paths you must use UNIX style directory separators (/ instead of \) and also place double quotes around the entire script name | UNIX/Linux Example: /usr/local/uptime/check_temp.sh Windows Example: "C:/my scripts/check_temp.bat" |
| Arguments | These are the arguments that you would like Uptime Infrastructure Monitor to pass into your monitoring station script. No arguments are required but please be aware that Uptime Infrastructure Monitor will automatically include the selected hostname as the first argument to your script. | temp 60 80 |
| Output Warning | This is the warning threshold used against the output returned from your monitoring station script. This is a textual comparison. You must select both a comparison method and a search string to enable the warning level threshold | Output contains: "warning" |
| Output Critical | This is the critical threshold used against the output returned from your monitoring station script. This is a textual comparison. You must select both a comparison method and a search string to enable the critical level threshold | Output contains: "critical" |
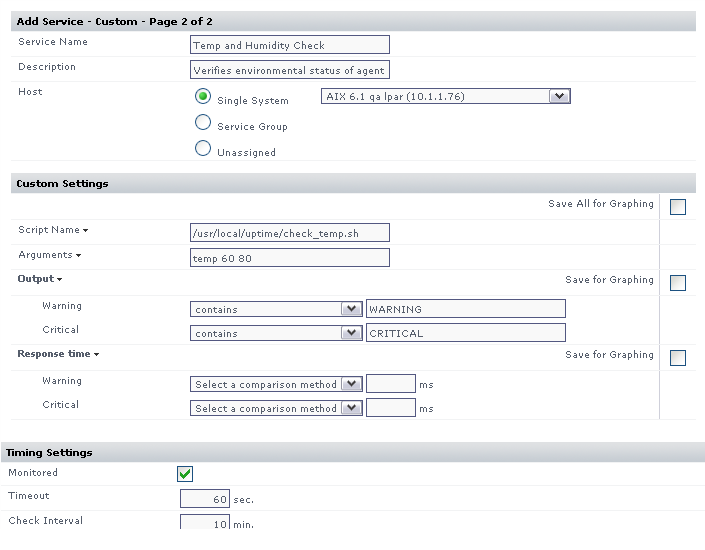
Based on the settings used in the example monitoring station script, configure the monitor with the following setting:
- Enter a name and description for the monitor.
- Select a host from the dropdown menu. Be sure to select the same host that your agent side script is on
- In the Script Name field, enter the path to the custom script on your monitoring station. On Windows systems be sure to use UNIX style / instead of \ and put quotation marks around your path. For example: "C:/my files/check_temp.bat"
- In the Arguments field, enter the arguments for the script. Uptime Infrastructure Monitor adds the agent name as the first argument automatically so do not include it.
- Select contains from the Warning dropdown and enter WARNING as the search text.
- Select contains from the Critical drop down and enter CRITICAL as the search text.
- Complete the remainder of the monitor template as you would for a normal service monitor.
Example monitor configuration
The image below illustrates a sample monitor configuration. This service monitor will indicate a WARN or CRIT whenever the monitoring station custom script returns WARNING or CRITICAL in its output.