Overview
In some cases, the standard up.time service monitors may not fully enable you to monitor all of the systems, applications, and proprietary devices in your environment; in some cases, you may need to capture unique metrics. To do this, you can configure advanced service monitors, or download and install customized plug-in monitors.
These advanced monitors can be simple scripts that run service checks on a host. You can write a shell script, or use a higher-level scripting language like Perl, Python, or Ruby. Or, the advanced monitors can be binary programs that interact with more sophisticated applications. On top of that, advanced monitors do not require an agent to be installed on the system that you are monitoring.
Regardless of how you develop your advanced monitor scripts or programs, those scripts or programs should return the following codes:
- 0 - OK
The services are functioning properly.
- 1 - Warning
There is a potential problem with one of more of the services being monitored.
- 2 - Critical
There is a critical problem with one or more of the services being monitored.
- 3 - Unknown
There is an error in the configuration of the monitor itself, or up.time cannot execute the service check.
up.time captures the output from the script or program, usually from standard output ( stdout ). The output appears in the service status section of the Global Scan panel (see Understanding the Status of Services). The up.time monitoring framework picks up any error codes and triggers the appropriate monitoring action.
If you have already written scripts or programs for other monitoring tools, you can re-use those scripts or programs with up.time . You simply point your advanced monitor to where your scripts or programs are located and up.time will run them.
The uptime user account on the up.time Monitoring Station must be able to execute the script or program that you use.
Note - Contact uptime software Client Support Services for help with creating custom monitor scripts.
Before You Begin
When creating a script or an executable for an advanced monitor, you should ensure that:
- the necessary interpreter for the scripting language that you are using is installed on the Monitoring Station
- you have determined the arguments that the script or program requires, and the parameters that you want your script or program to return
- you use forward slashes when specifying directory paths in your scripts, regardless of the operating system (e.g., C:/ on Windows, or
/opt on Solaris or Linux)
Many of the fields that you use to define an advanced monitor are the same as those used with agent and agentless monitors. You can find more information about those fields in the following sections.
- To learn how to access the custom monitor definition window, see Using Agentless Monitors.
- For a description of monitor identification information fields, see Monitor Identification.
- For a description of monitor timing settings, see Monitor Timing Settings.
- For a description of alert settings, see Monitor Alert Settings.
- For a description of Alert Profiles, see Alert Profiles.
- For a description of Action Profile, see Action Profiles.
Custom Monitors
A Custom monitor runs a script that captures information which is related to a situation that may be unique to your environment. When the script is run, the system being monitored returns a single line of information to standard output ( stdout ). The script reads stdout , which may contain an error or return value. This error or return value is then displayed in the up.time Monitoring Station.
As well, you can specify that the monitor writes the data that the script returns to the up.time DataStore. You can use the retained data to later generate a Service Metrics report (see Service Monitor Metrics Report) or a Service Metrics graph (see ).
Configuring Custom Monitors
To configure Custom monitors, do the following:
- In the Custom monitor template, complete the monitor information fields.
To learn about monitor information fields, see Monitor Identification. - Complete following fields:
Script Name
The name of, and path to, the script or program on the Monitoring Station that will collect metrics.Note - The uptime user account on the up.time Monitoring Station must be able to execute the script or program that you use. Ensure that the permissions for the uptime user account are set correctly.- Arguments (Optional)
Specify any arguments that are required by the script or program. - Output (Optional)
Specify a comparison method to override the settings of an Alert Profile, or to return only the most severe errors.
Do this by selecting an option from the Comparison Method dropdown lists beside the Warning and Critical fields. Then, enter a value in the field. For example, to return only unknown errors you can select Exactly Matches from the dropdown list, and type UNKNOWN in the field.
For more information on comparison methods, see Comparison Methods. - Response Time
Optionally, enter the Warning and Critical Response Time thresholds. For more information, see Configuring Warning and Critical Thresholds.
- Click the Save for Graphing option to save the output in the DataStore. You can later use the retained data to generate a report or a graph.
- Complete the following settings:
- Timing Settings (see Adding Monitor Timing Settings Information for more information)
- Alert Settings (see Monitor Alert Settings for more information)
- Monitoring Period settings (see Monitor Timing Settings for more information)
- Alert Profile settings (see Alert Profiles for more information)
- Action Profile settings (see Action Profiles for more information)
- Click Finish .
Custom with Retained Data
Custom monitors with Retained Data return the following information:
- up to 10 values that you can save and evaluate
- a return status of 0 to 3 (see Overview for more information)
You can specify whether the monitor writes any returned data to the up.time DataStore. You can use the retained data to later generate a Service Metrics report (see Service Monitor Metrics Report) or a Service Metrics graph (see Viewing System and Service Information).
You can also specify whether the monitor will use retained values as arguments in the custom monitor script. The values used are from the last instance the monitor was run. This most recent data sample can be used in cases where you would like to set alerts based on value comparisons.
When you wish to refer to retained values in a script, use the following environment variable as an argument:
%UPTIME_PREV_CUSTOM#%
Replace “ # ” with the ordered value the custom monitor has been configured to save (i.e., 1 - 10 ).
For example, running a sample script called application.exe with the following arguments would make use of retained values for Variable 1 and Variable 5 as retained by the monitor:
%UPTIME_PREV_CUSTOM1% %UPTIME_PREV_CUSTOM5%
Configuring Custom Monitors with Retained Data
To configure Custom monitors with Retained Data, do the following:
- In the Custom with Retained Data monitor template, complete the monitor information fields.
To learn how to configure monitor information fields, see Monitor Identification. - Complete the following fields:
Script Name
The name of, and path to, the script or program on the Monitoring Station that will collect metrics on the system.Note - The script or program that you specify must be executable by the uptime user account on the up.time Monitoring Station. Ensure that the permissions are set correctly.- Arguments (Optional)
Specify any arguments required by the script or program. - Pass retained variables from previous collection as environment variables
Select this checkbox if you would like the monitor to be able to use the most recently collected variables as arguments in the script. - Variable 1 to Variable 10 (Optional)
Specify up to 10 variables that your custom script will return to the up.time Monitoring Station. If you click the Save for Graphing checkbox, these variables will be saved to the DataStore. - Response Time
Enter the Warning and Critical Response Time thresholds. For more information, see Configuring Warning and Critical Thresholds. - Complete the following settings:
- Timing Settings (see Adding Monitor Timing Settings Information for more information)
- Alert Settings (see Monitor Alert Settings for more information)
- Monitoring Period settings (see Monitor Timing Settings for more information)
- Alert Profile settings (see Alert Profiles for more information)
- Action Profile settings (see Action Profiles for more information)
- Click Finish.
External Check
The External Check monitor captures asynchronous events. up.time does not actively monitor these events by polling or initiating service checks, Instead, External Check monitors rely on an external event to generate the information that the monitors capture. External Check monitors enable you to determine when to collect service data for the event that you specify.
After you define an External Check monitor, the monitor runs a Perl script named extevent.pl . The script extevent.pl is included with up.time , in the scripts subfolder. When it is run, the script connects to the port on which the server is listening. It then triggers the application on the server that generates the external event that is sent to up.time .
This script extevent.pl has the following command line syntax:
extevent.pl --host=Hostname --port=PortNumber
--status=StatusNumber --message=message
--monitorName=name
Where:
- host
The host name of the server that is running up.time . - port
The up.time port on the server (usually 9996 ). - status
The status of the service being monitored. See Overview for more information. - message
A human readable diagnostic message. monitorName
The name of the service monitor to which the output will be returned.Note - Before using an External Check monitor, contact uptime software Client Support Services for assistance. You will need specific detailed instructions for configuring this monitor depending on the nature of the applications that will be generating asynchronous events for up.time .
Configuring External Check Monitors
To configure External Check monitors, do the following:
- In the External Check monitor template, complete the monitor information fields.
To learn how to configure monitor information fields, see Monitor Identification. - Complete the following settings:
- Timing Settings (see Adding Monitor Timing Settings Information for more information)
- Alert Settings (see Monitor Alert Settings for more information)
- Monitoring Period settings (see Monitor Timing Settings for more information)
- Alert Profile settings (see Alert Profiles for more information)
- Action Profile settings (see Action Profiles for more information)
- Click Finish.
Plug-In Monitors
up.time can be integrated with plug-in monitors that are not part of the standard distribution. Plug-in monitors are custom service monitors that have been created by uptime software, or other up.time users.
The benefit of sharing plug-in monitors is that uptime customers with relatively unique, but not exclusive, monitoring needs can share the results of their efforts with each other. Additionally, if uptime software creates a custom plug-in monitor for a customer’s environment, this monitor would then be available to all customers.
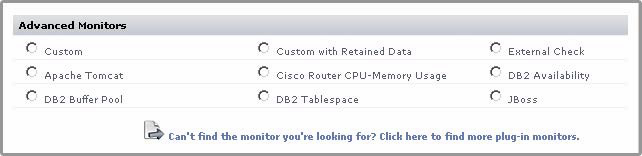
The uptime Support Portal is the host to all plug-in monitors. There, you can find and download a plug-in monitor archive before installing it on your Monitoring Station. All plug-in monitors that have been installed will always appear in the Add Service Monitor window, ready to be configured as would any pre-packaged system monitor:
Installing Plug-In Monitors
To use a plug-in monitor with up.time , do the following:
- Download the plug-in monitor from the uptime Support Portal.
- Locate the loadpluginmonitor script, which is found in your up.time scripts directory.
- In a command line shell, change to the
[UP.TIME_HOME]/scripts/ directory, and locate the loadpluginmonitor script. - Run the loadpluginmonitor script with a single argument that points to the location and name of the plug-in monitor you downloaded.
The plug-in monitor will be installed in a subdirectory under the
/scripts directory. The installation directory is determined by the plug-in monitor’s XML file. - Run the up.time GUI.
- Click Services on the up.time tool bar.
- Click Add Service Instance in the Tree Panel .
The Add Service Monitor window appears. - In the Advanced Monitors section, you will see the plug-in monitor you added to up.time .
You can now select and configure the plug-in monitor.