...
Viewing the Network Dashboard
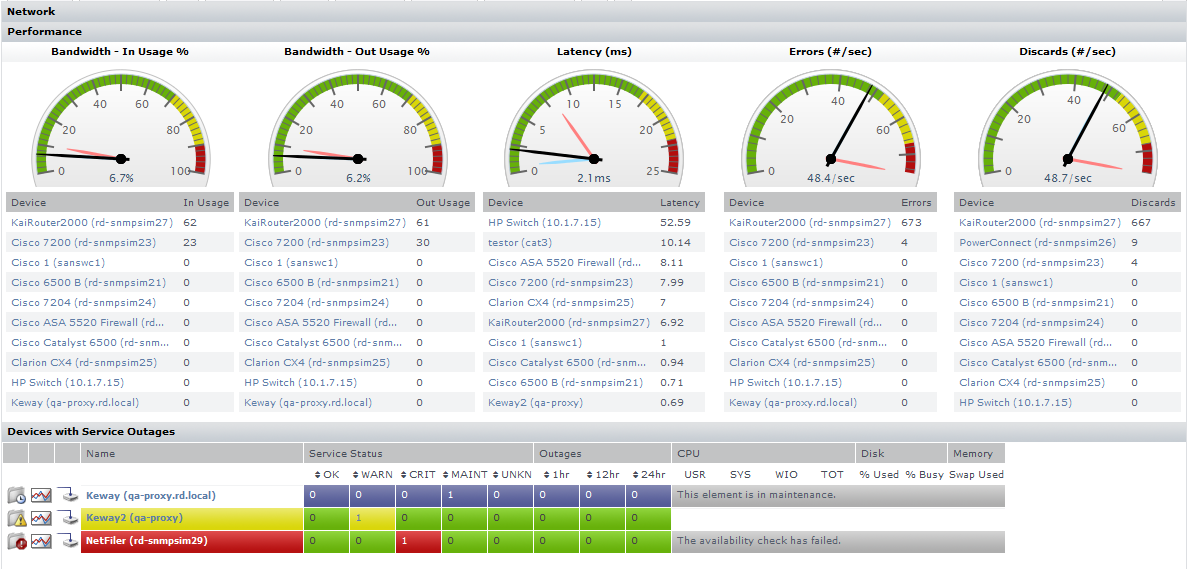
The network dashboard is a summary of network device performance, and network-based service monitor outages. It is automatically updated every 30 seconds. You can view this dashboard by clicking the Network tab.
The network dashboard provides you with a single view of your network environment, and keeps you abreast of any network-related issues:
- instantly spot network capacity issues, and compare trends over the past day
- pinpoint top resource consumers to help resolve performance bottlenecks before they cause an outage
- immediately spot network devices that are currently failing, and click through to investigate the root cause
The following metrics are together used to report network performance:
In Usage | global inbound bandwidth usage of all monitored network devices’ ports | |
Out Usage | global outbound bandwidth usage of all monitored network devices’ ports | |
Latency | network device latency values collected through each monitored Element’s ping monitor does not include network devices without an assigned ping monitor | |
Errors | the average number of errors per second through all monitored network device ports | |
Discards | the average number of packets discarded per second through all monitored network device ports | |
For each category, there is a performance gauge that displays the average for all monitored ports based on the most recent sample. Maximum and minimum values over the last 24 hours is also shown. Note that the first two metrics are percentage-based, and their gauges are static; the remaining three metrics' gauges may scale if the recorded value exceeds the default upper limit. The thresholds for the service status indicators are typically 70% for a warning state, and 90% for a critical state.
Additionally for each category, there are top-10 lists displaying the individual Elements that are using the most bandwidth, have the highest latency, or seeing the most errors or discarded packets. Clicking any Element name displays its Quick Snapshot page, where you can further investigate bottlenecks.
Devices with Service Outages
Any network device Element whose attached service monitors are experiencing outages are displayed in this section. For convenience, you can sort the results by number of current outages, or outage occurrences.
| Info |
|---|
If the dashboard is viewed by an Uptime Infrastructure Monitor user who does not have permission to view all Elements, and as a result, may not be able to see network device Elements, the list is empty, and Uptime Infrastructure Monitor reports that there are no available network devices. |
Viewing All Elements
Elements are the systems, network devices, Applications, and SLAs that Uptime Infrastructure Monitor is currently monitoring. You can view the status of all monitored Elements on the All Elements dashboard. This can be accessed by clicking the All Elements tab.
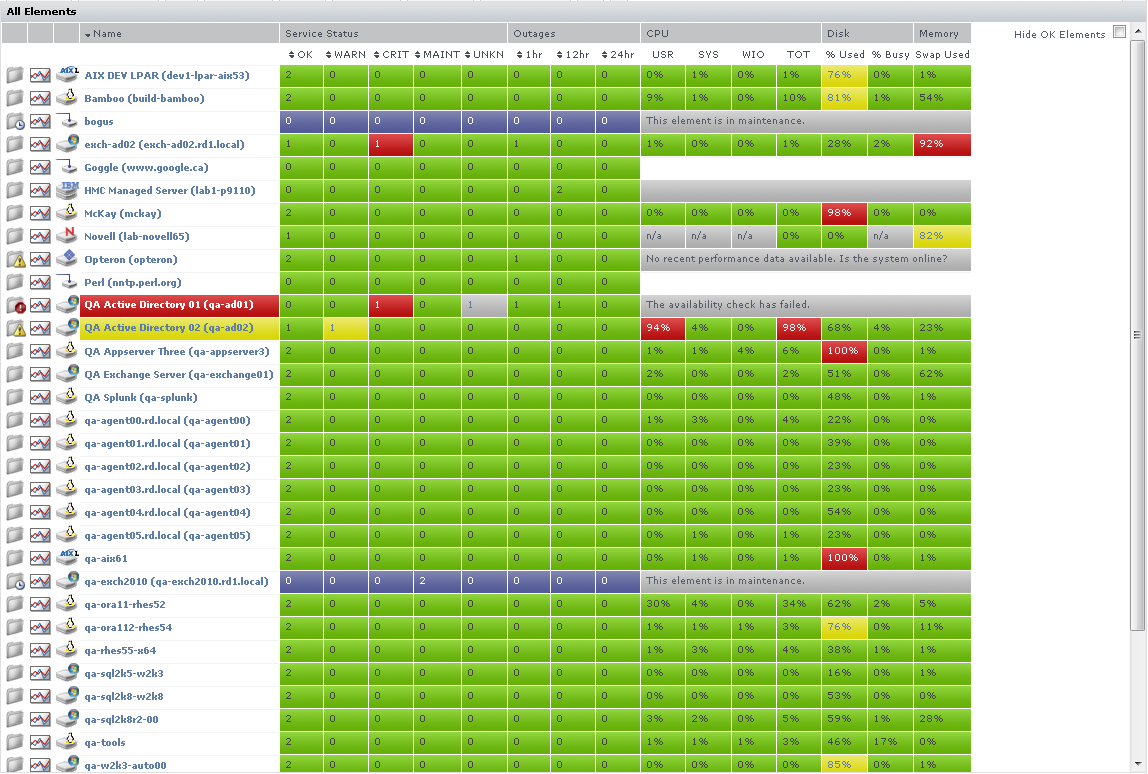
The Elements subpanel lists the following information:
- the names of the Elements in your environment
- the status of the services that are assigned to each Element
- the number of outages over the last hour, 12 hours, and 24 hours
- the percentage of CPU resources consumed by users, the system, and by disk I/O
- the percentage of the system disk that is used and the percentage that is busy
- the amount of memory swap space that is used
For convenience, you can sort the Elements table by any outage type.
If Uptime Infrastructure Monitor cannot contact an Element, the reason is displayed:
- The availability check has failed.
- This element is in maintenance.
- This VM is currently powered off.
The values in each column are hyperlinks. Click one of the links to display the following information in the system information or graphing subpanels:
- Click any value in the OK, WARN, CRIT, MAINT, or UNKNOWN columns to open the Element's Status subpanel.
- Click any value in the Outages column to open the Element's Outages subpanel.
- Click any value in the USR, SYS, WIO, or TOT columns to open the Element's Usage% Busy report subpanel. For more information about the Usage report, see Usage (% busy) for more information.
- Click any value in the % Used column to open the Element's File System Capacity report subpanel. For more information about graphing the file system capacity, see File System Capacity Graph.
- Click any value in the % Busy column to open the Element's Disk Performance Statistics report subpanel. For more information about graphing the disk performance statistics, see Disk Performance Statistics Graph.
| Info |
|---|
By default, Elements in WARN or CRIT states, in maintenance, or whose status is undetermined are displayed. To display all Elements regardless of status, unselect clear the Hide OK Elements check box. |
...