...
Viewing All Applications
The Applications dashboard displays the status of all Applications that the currently logged in user is permitted to view. Applications are groups of service monitors that together represent the status of a greater business or IT function within your organization. They consist of any number of two types of monitors:
- master service monitor: used to determine the status of the Application as a whole
- regular service monitor: does not affect Application status, but helps provide a complete picture by representing a secondary service, or a direct dependency of a master service
On the dashboard, the overall status of each Application is color coded:
- Applications functioning normally are marked with a check box icon (
 )
) - Applications undergoing maintenance are marked with a scheduled maintenance icon (
 )
) - Applications in a warning state are highlighted in yellow and marked with a warning icon
- Applications in a critical state are highlighted in red and marked with a critical icon
The number and status of an Application's service monitors are also displayed through a series of bars: green indicates the service is functioning normally; yellow means the service is in a warning state; and red indicates the service is in a critical state. This information can be displayed in a default Condensed View, or a Detailed View.
Condensed View
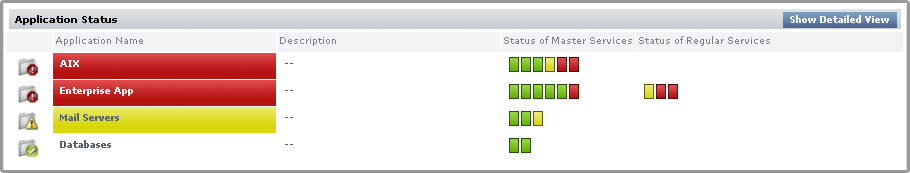
The Condensed view is the default view for the dashboard and displays the following information:
- the name of the Application
- a description of the Application
- the status of each service in the Application
The status of the service is denoted by a colored bar in the Status of Master Services and Status of Regular Services columns. For example, if there are three services associated with the Application and their status is OK then three green bars appear in this column.
Detailed View
Click the Show Detailed View button to change to a detailed view of the dashboard.
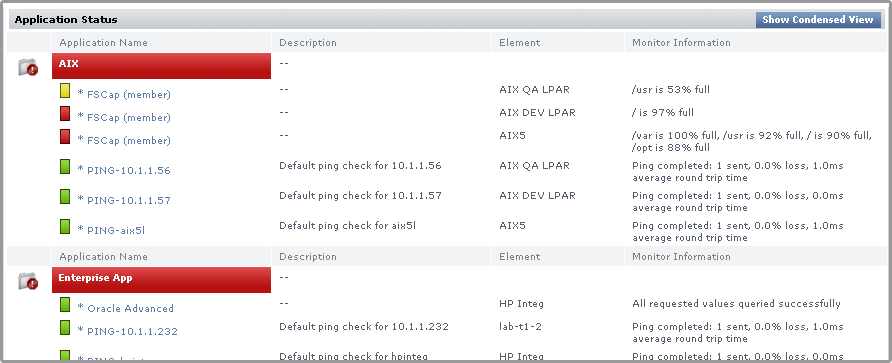
In this view, more information is provided for each of an Application's component service monitors, including the monitor's most current status message. Service monitor names can be clicked, taking you to the service status page for the host to which it is attached.
Master service monitors in an Application are marked with an asterisk (*). The status of a service is denoted by a colored bar beside the name of the service.
...