...
Table of Contents
...
Overview
While up.time Uptime Infrastructure Monitor offers powerful reporting features, you may want to generate reports that use a specific set of data or a custom report format. Using Crystal Reports, you can retrieve data from the up.time DataStore and use it to create reports that meet your individual requirements.
...
- Start Crystal Reports and click the Standard Report Wizard icon.
The following window should appear:
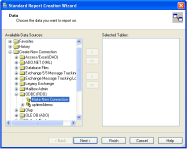
- In the Data Source column of the Standard Report Creation Wizard window, expand the Create New Connection and ODBC (RDO) folders.
- Double-click Make New Connection.
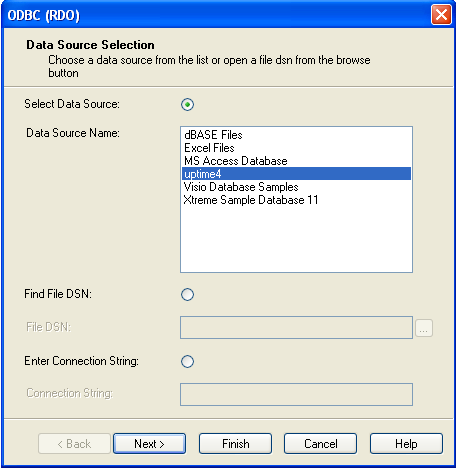
The Data Source Selection window should appear:

- In the Data Source Name list, click up.time Uptime Infrastructure Monitor and then click Next.
- When prompted for a user ID and password, enter
reportsandreportsand then click Finish. - The connection will appear in the Make New Connection window. Expand the connection and double-click Add Command.
The Add Command to Report window should appear.
Enter the following code in the column in the left portion of the window:
Code Block language sql select e.display_name, avg(p.cpu_usr + p.cpu_sys + p.cpu_wio), DATE(s.sample_time) from performance_samples, performance_aggregate p, entity e where s.id = p.sample_id and e.entity_id = s.uptimehost_id and s.sample_time > "2010-11-23" and s.sample_time < DATE_ADD("2010-11-23", INTERVAL 7 DAY) group by DATE(s.sample_time), e.display_name order by DATE(s.sample_time), e.display_name;This example will report on the CPU workload average for all systems over the seven day period from 2010-11-23 to 2010-11-30.
- Click OK after you change the range to suit your needs.
The Standard Report Creation Wizard will start.
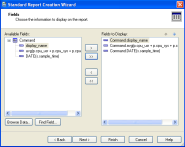
Use the Wizard to control the appearance of the report.
- Select the fields to display in the report and then click Next.
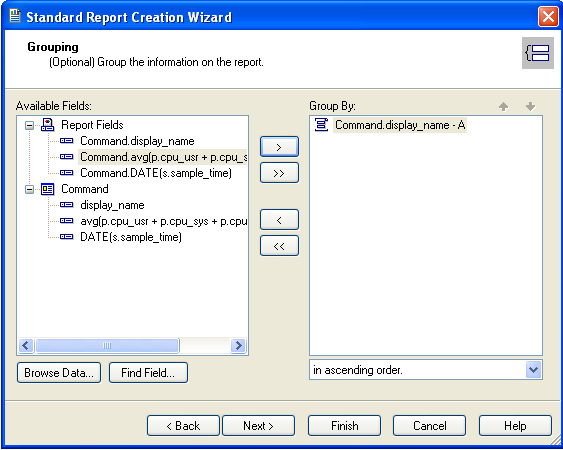
- On the Grouping screen, select
display_nameto group the systems by their host names, and then click Next.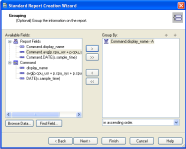
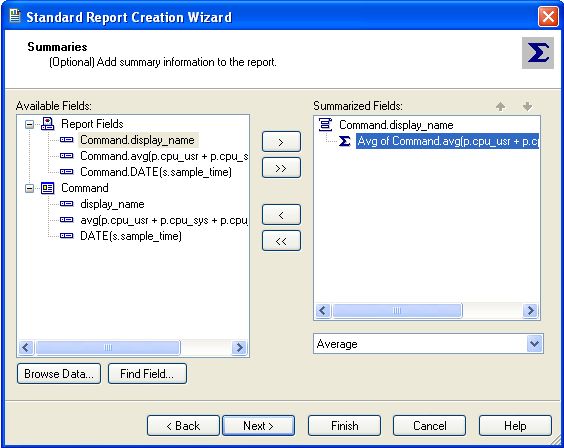
- On the Summaries screen, select
avg(p.cpu_usr + p.cpu_sys + p.cpu_wio)from the Available Fields column, and then select Average from the drop-down list below the Summarized field column.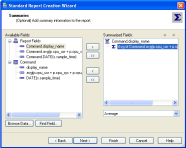
- Click Next.
- Select None for group ordering and click Next.
- Select No Chart and then click Next.
- Do not choose any subset information to display, and then click Next.
- Select the template that you want to use and then click Finish.
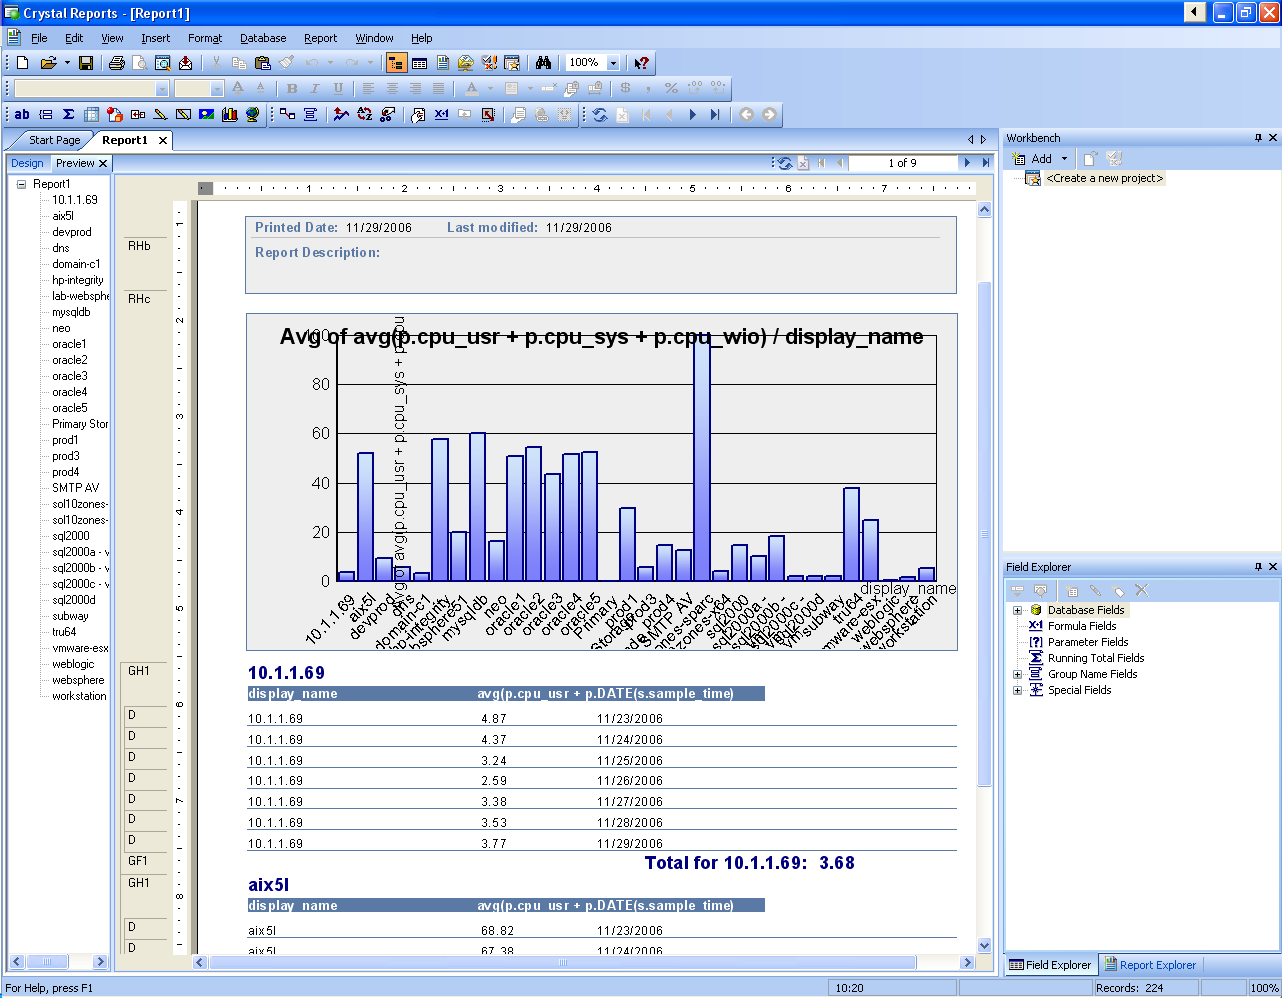
Crystal Reports will now generate the report, as shown below:
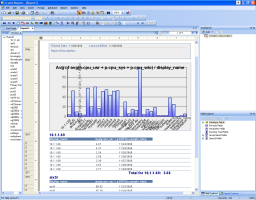
- Save the report by selecting Save from the File menu.


...