Contents
Overview
While Uptime Infrastructure Monitor offers powerful reporting features, you may want to generate reports that use a specific set of data or a custom report format. Using Crystal Reports, you can retrieve data from the up.time DataStore and use it to create reports that meet your individual requirements.
Before You Begin
If you have not already done so, install the MySQL ODBC driver and create a data source to access the up.time DataStore. For more information, see Connecting to the up.time DataStore via ODBC.
Configuring a Report in Crystal Reports
To configure a report in Crystal Reports:
- Start Crystal Reports and click the Standard Report Wizard icon.
The following window should appear:
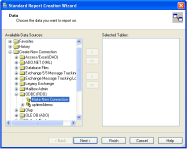
- In the Data Source column of the Standard Report Creation Wizard window, expand the Create New Connection and ODBC (RDO) folders.
- Double-click Make New Connection.
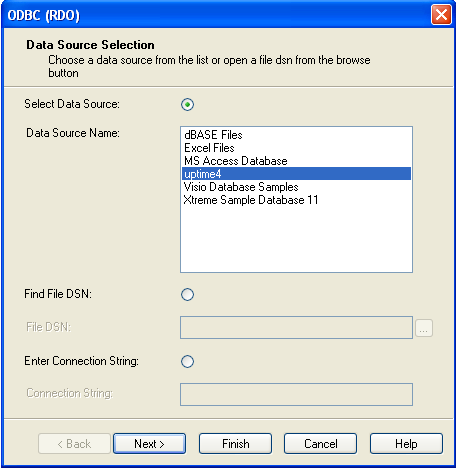
The Data Source Selection window should appear:

- In the Data Source Name list, click Uptime Infrastructure Monitor and then click Next.
- When prompted for a user ID and password, enter
reportsandreportsand then click Finish. - The connection will appear in the Make New Connection window. Expand the connection and double-click Add Command.
The Add Command to Report window should appear.
Enter the following code in the column in the left portion of the window:
select e.display_name,
avg(p.cpu_usr + p.cpu_sys + p.cpu_wio),
DATE(s.sample_time)
from performance_samples, performance_aggregate p, entity e
where s.id = p.sample_id
and e.entity_id = s.uptimehost_id
and s.sample_time > "2010-11-23"
and s.sample_time < DATE_ADD("2010-11-23", INTERVAL 7 DAY)
group by DATE(s.sample_time), e.display_name
order by DATE(s.sample_time), e.display_name;
This example will report on the CPU workload average for all systems over the seven day period from 2010-11-23 to 2010-11-30.
- Click OK after you change the range to suit your needs.
The Standard Report Creation Wizard will start.
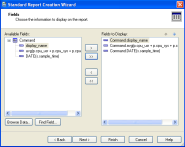
Use the Wizard to control the appearance of the report.
- Select the fields to display in the report and then click Next.
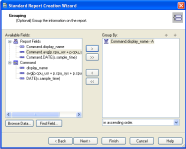
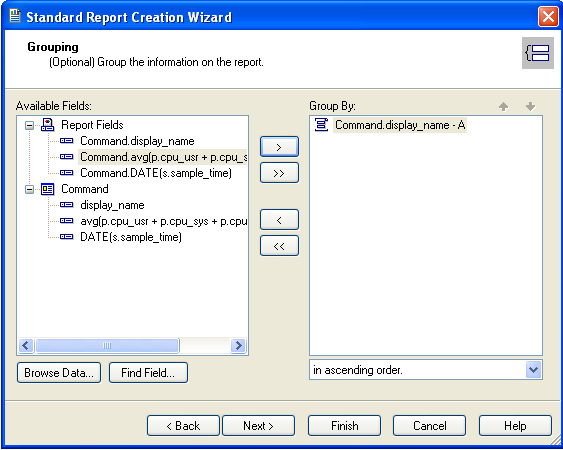
- On the Grouping screen, select
display_nameto group the systems by their host names, and then click Next.
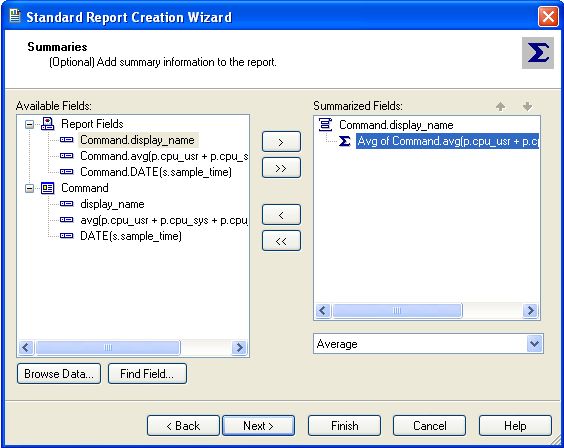
- On the Summaries screen, select
avg(p.cpu_usr + p.cpu_sys + p.cpu_wio)from the Available Fields column, and then select Average from the drop-down list below the Summarized field column.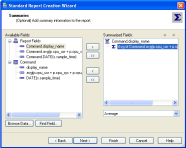
- Click Next.
- Select None for group ordering and click Next.
- Select No Chart and then click Next.
- Do not choose any subset information to display, and then click Next.
- Select the template that you want to use and then click Finish.
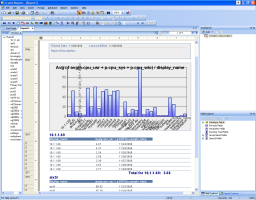
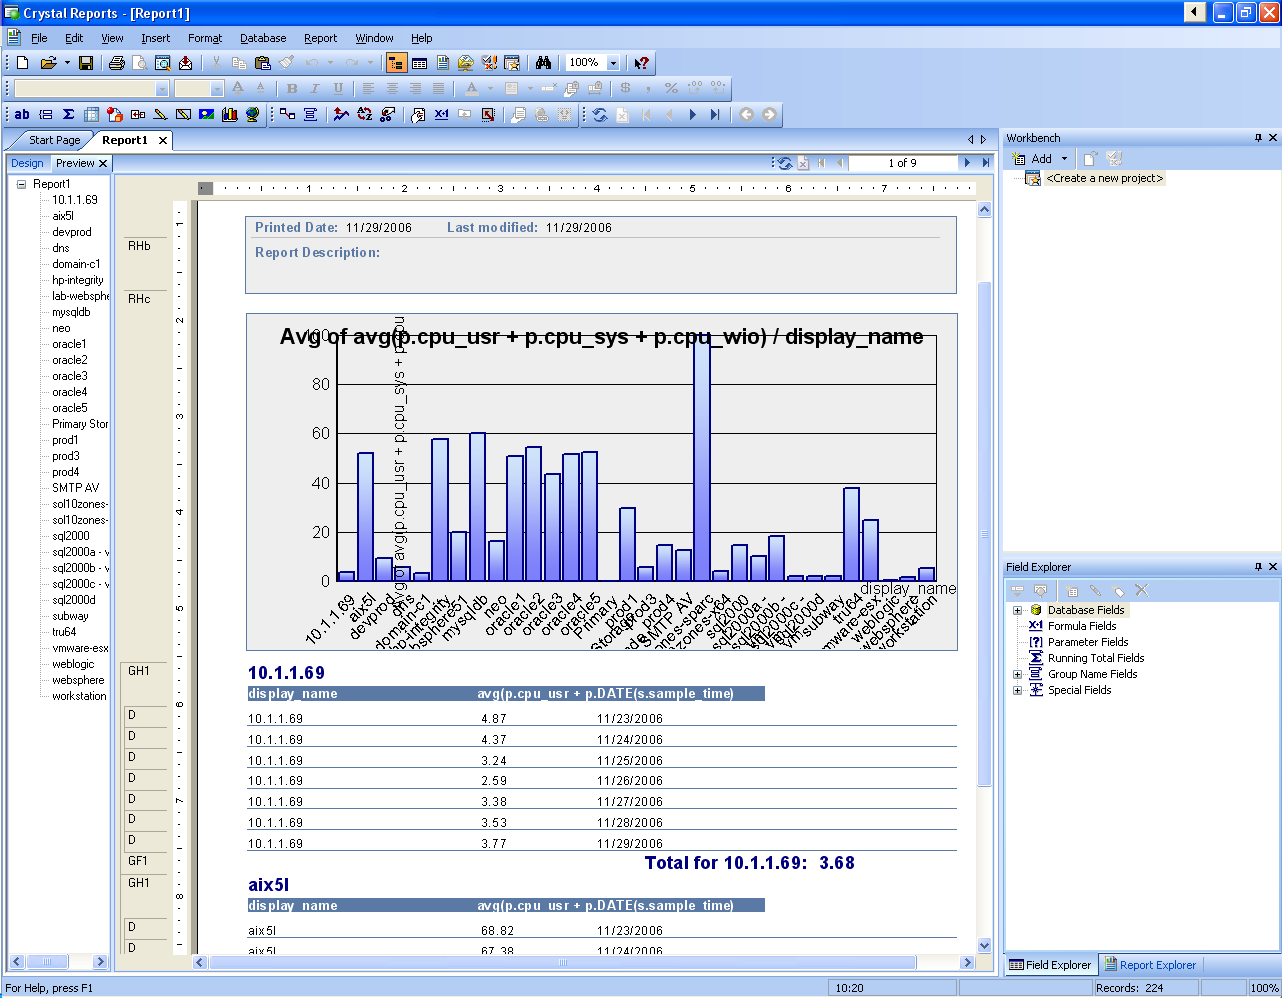
Crystal Reports will now generate the report, as shown below:
- Save the report by selecting Save from the File menu.


Note
Modifying the Sample Report
Download the sample report that was created earlier, open it locally with the settings intact and then modify the sample report as required by following these steps:
- Download the sample report using the link to the right.
- Open the file in Crystal Reports.
- Click Database / Set Datasource Location.
- In the Set Datasource Location window, click on the current data source.
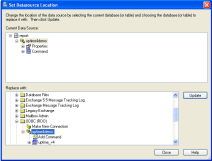
- Locate your ODBC source in the bottom part of the window, click Update and then click Close.
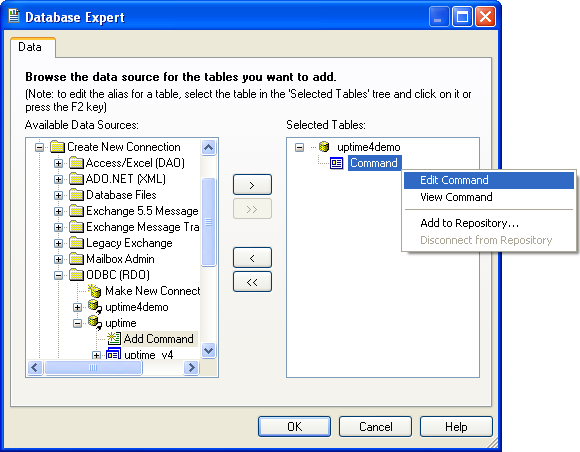
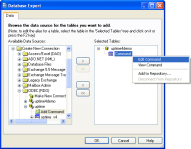
- Click on Database / Database Expert.
- In the Selected Tables column, right-click on Command and choose Edit Command.
- Modify the report to suit your needs.
Click OK when you are finished.