\n
\n
\n
\n | Related Documentation |
\n Version of up.time affected |
\n Affected Platforms |
\n
\n
\n Connecting to the up.time DataStore via ODBC
\n
\nWorkload Heatmap with Tableau
\n |
\n All |
\n All |
\n
\n
\n
\n
\n
\nArticle Contents
\n
\n
\n
\nOverview
\n
\nWhile up.time offers powerful reporting features, you may want to generate reports that use a specific set of data or a custom report format. Using Tableau, you can retrieve data from the up.time DataStore and use it to create reports that meet your individual requirements.
\n
\nFor a functional example of how you can use Tableau to create reports, see this posting on the uptime Community Forum.
\n
\n
\nBefore You Begin
\n
\nIf you have not already done so, install the MySQL ODBC driver and create a data source to access the up.time DataStore. For more information, see the Connecting to the up.time DataStore via ODBC Knowledge Base article.
\n
\n
\nConfiguring a Report in Tableau
\n
\nTo configure a report in Tableau:
\n
\n
\n- Start Tableau.
\n- Select Data and then click Connect to Data Source.
\n- Double click New Connection.
\n- Choose MySQL Database.
\n- In the Enter a Server name field, type the name of the server that is hosting the DataStore that you want to connect to.
\n- Enter the port on which the DataStore is listening in the Port field (the default port for the DataStore is 3308).
\n- In the Username and Password fields, enter
reports and reports.
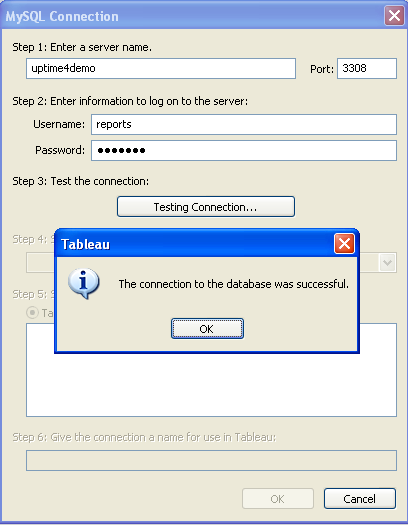
\n- Click the Test Connection button.
\n
A message will appear confirming if Tableau was able to connect to the DataStore, as shown below:
\n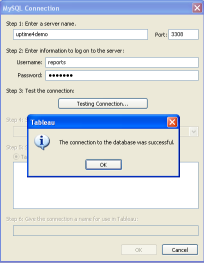
\n
\n- Select the uptime database from the dropdown menu.
\n- Select the Custom SQL option and enter the following statement in the text area:
\n
\nselect e.display_name,avg(p.cpu_usr + p.cpu_sys + p.cpu_wio),
\nDATE(s.sample_time) from performance_sample s,
\nperformance_aggregate p, entity e
\nwhere s.id = p.sample_id
\nand e.entity_id = s.uptimehost_id
\nand s.sample_time > "2010-11-17"
\nand s.sample_time < DATE_ADD("2010-11-17", INTERVAL 7 DAY)
\ngroup by DATE(s.sample_time), e.display_name
\norder by DATE(s.sample_time), e.display_name
\n
\n
\nThe above example will report on the CPU workload average for all systems over the 7-day period from 2010-11-17 to 2010-11-24.
\n
\n- Click OK when finished.
\n
\n
\n
\nModifying How the Report Displays Information
\n
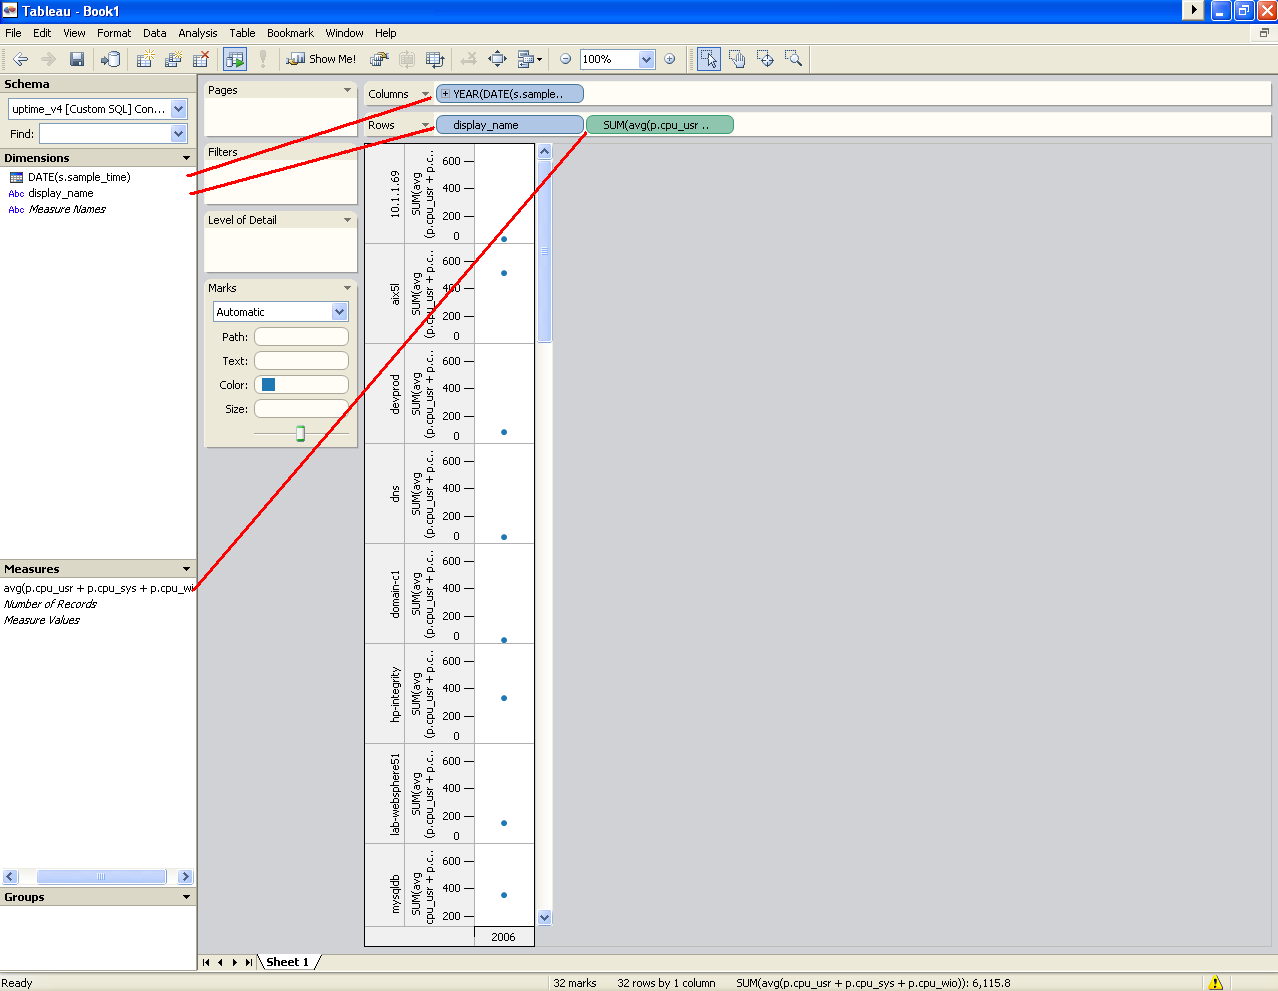
\nYou can quickly and easily change the information in a Tableau report to suit your needs, as illustrated below:
\n
\n
\n
\nIn the above example, display_name and avg(p.cpu_usr + p.cpu_sys + p.cpu_wio) are moved into Rows by clicking with the mouse, dragging the values from the left hand column and dropping them in the Rows field. DATE(s.sample_time) is moved to Columns in a similar way. By default, Tableau may format the DATE(s.sample_time) to only display the year, and format avg(p.cpu_usr + p.cpu_sys + p.cpu_wio) to add the results.
\n
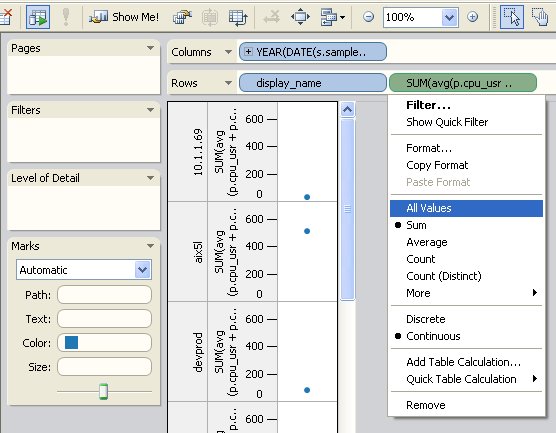
\nTo change this presentation, hold your mouse over any of the fields and click the arrow that appears on the right side of the field to open the following menu:
\n
\n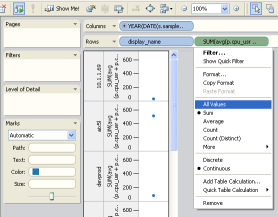
\n
\nSelect All Values from the menu for both the display_name and avg(p.cpu_usr + p.cpu_sys + p.cpu_wio) fields (you may need to move or alter some fields to modify the default Tableau formatting).
\n
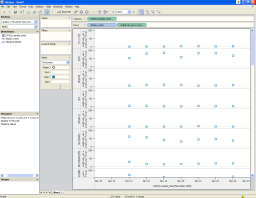
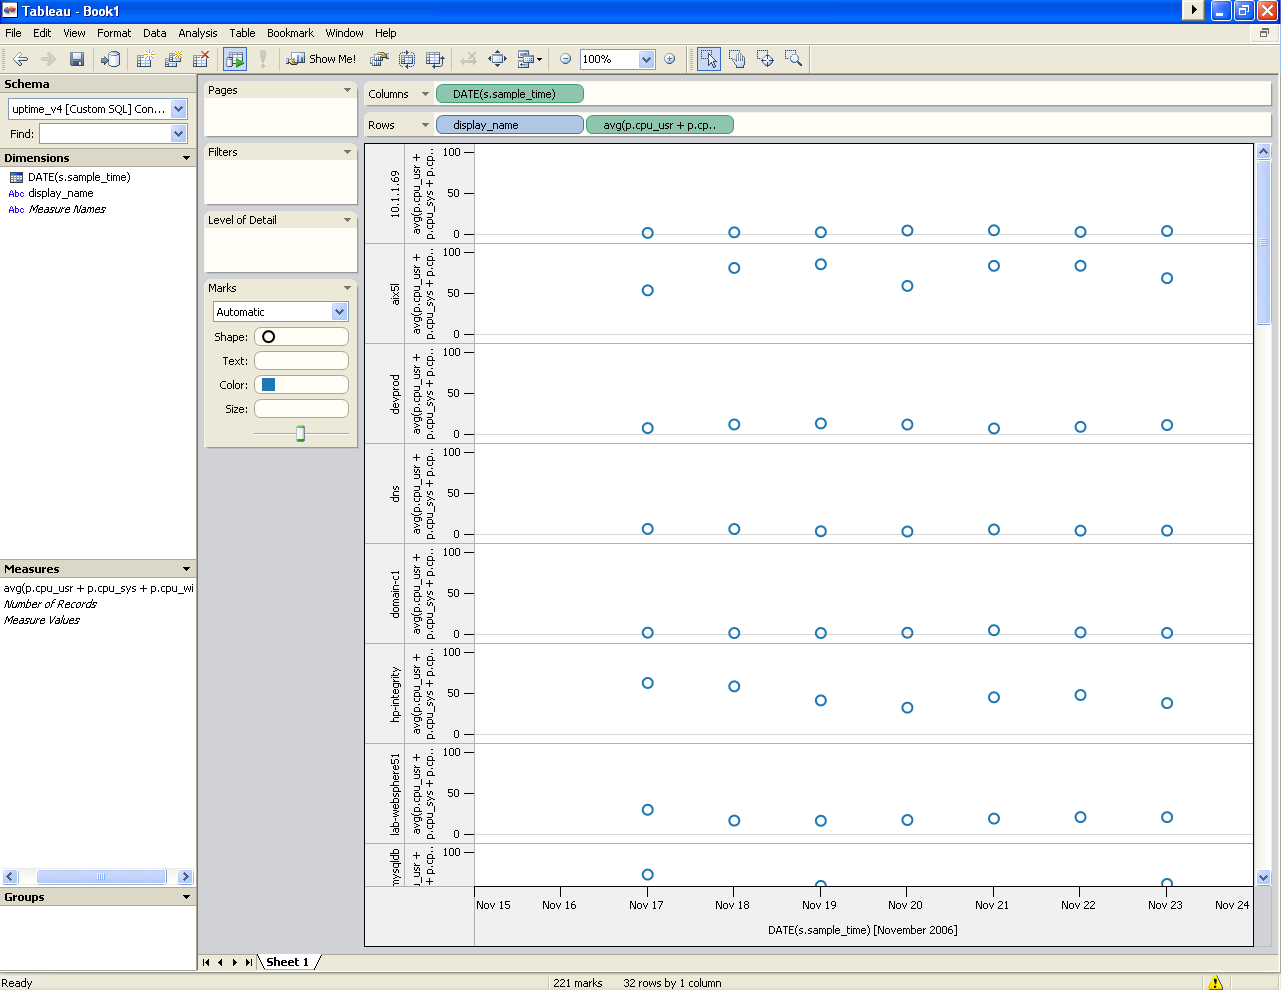
\nThe following image illustrates a formatted Tableau report:
\n
\n