...
Generate a Resource Hot Spot Report
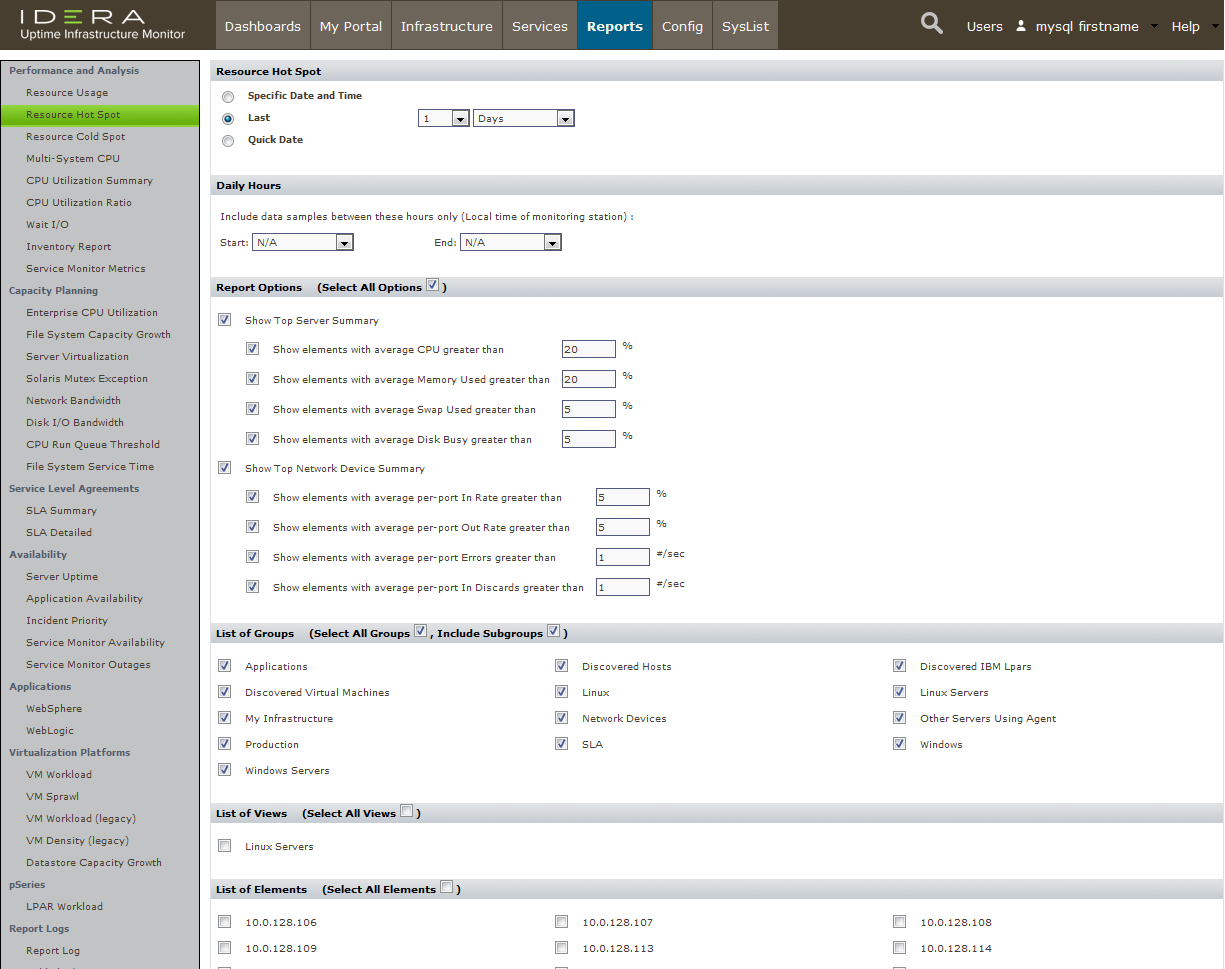
- Click Reports, then click Resource Hot Spot in the left pane.
- In the opening set of of options, click Last, then leave the selection at 1 Days.
Because you presumably have only had these Elements monitored over the course of this Getting Started Guide, you do not have more than a days' worth of data to draw; however, feel free to increase the time frame if you have collected more data. - In the Report Options, let's Select All Options to also include any possible network-device issues.
- The report allows you to define what constitutes a hot spot, and the default values are reasonable. In the hopes of having some "resource gluttons" appearing in your report, let's manufacture a crisis, and configure new, lower thresholds, as shown below:
- CPU Used: 20%
- Memory Used: 20%
- In-Rate: 5%
- Out-Rate: 5%
Below the Report Options section are three sections that allow you to select what is to be included in the report. You can use any of the ways you've organized your inventory to select which Elements are included in the report: Element Groups, Views, and individual Elements.
Note in the above screenshot that the Linux Servers View you created in the previous module, and the Production, Linux Servers and Windows Servers Element Groups you created in the module before that are available. - For simplicity, select All Groups from the List of Groups section (as shown in the image above), to include everything we have added to our monitored inventory.
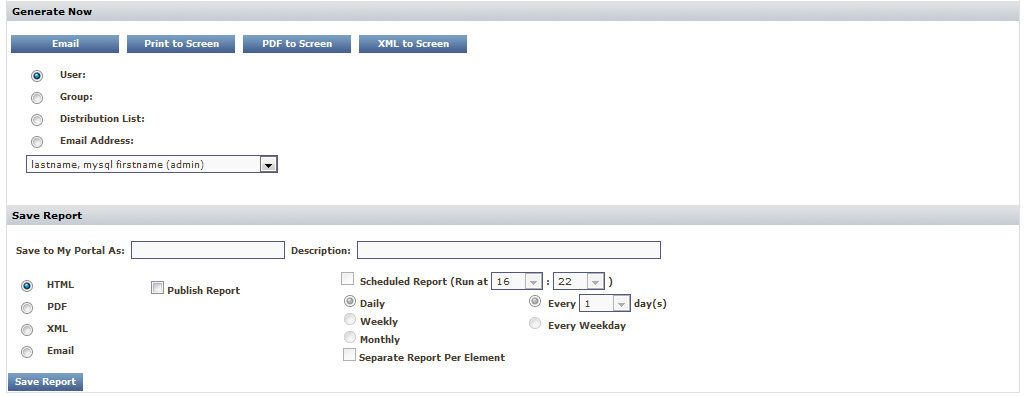
- Scroll to the bottom of the page to view the last two sections: Generate Now and Save Report:
When configured to perfection, reports can be saved to be generated at a precise time, at a specific schedule, in various formats. Users also can save reports to their My Portal. Administrators and end-users can schedule reports for themselves, or as part of an agreement, deliver them to managers.
Reports can also be generated in real time, to assist with diagnosis, or to fine-tune the configuration of a report. This example uses this process. - In the Generate Now section, click Print to Screen.
Validation: Admire the Resource Hot Spot Report
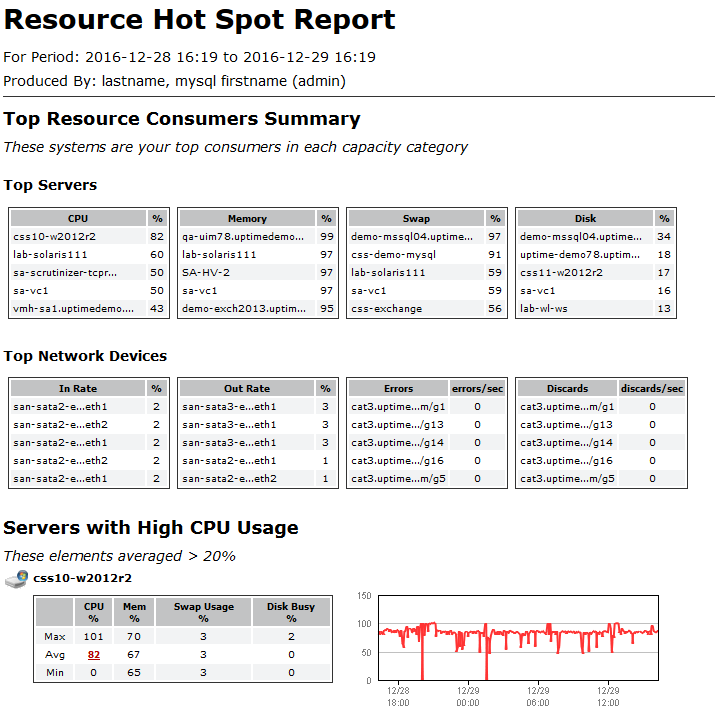
The results of the report depends on the activity and performance of your Elements, but hopefully there is enough activity for resource hot spots to be listed, such as in the following example:
The opening Top Resource Consumers Summary lists Elements regardless of your configured thresholds; subsequent sections list any hot-spot Elements.
Generate a Pre-configured Server Uptime Report
When Uptime Infrastructure Monitor is first installed, a few broad-coverage, quick-value reports are created out of the box for the admin user. One of these is the Server Uptime report, which is ideal for all the ESX hosts and VMs that are managed by your VMware vCenter Server Element.
- Click My Portal, then click the Saved Reports tab.
- Note the report you generated in the last exercise is also in this list as a pre-configured report. One of the benefits users saving reports to their respective My Portal Saved Reports lists is they can generate at any time, based on saved settings. Let's demonstrate how to live in the moment.
Click the play icon to print the Server Uptime Report to screen.
Validation: Review the Server Uptime Report
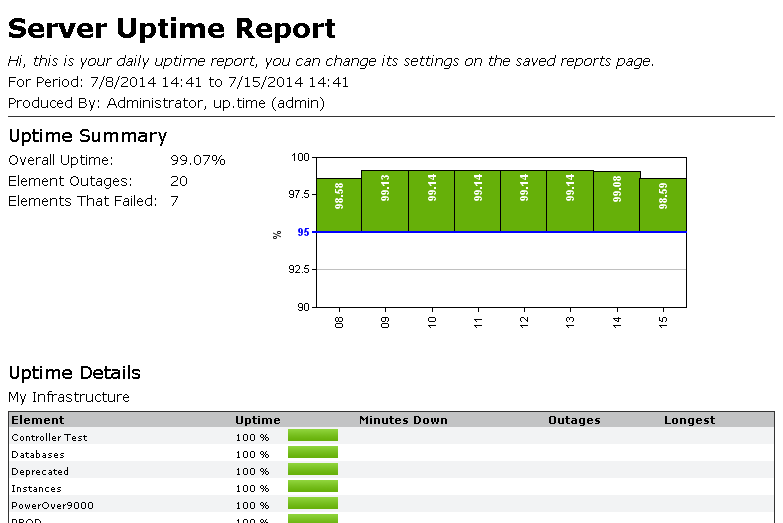
The pre-configured options for this report include all of your Elements (by the report configuration, the Infrastructure Element Group, as well as its subgroups), and whether they met a target uptime threshold of 95%. This is reported for the last seven days. If you have completed all of this guide in the same sitting, unless you are very slow, you won't have a week's worth of data to display. Uptime Infrastructure Monitor reports with however much data it has collected, which in this case is likely a day's worth. The following example shows a full week of meeting up-time targets, with a modest number of outages:
Now that you've touched on a couple of reports, let's go back to what are essentially a real-time status report, the Quick Snapshot.
Revisit the Quick Snapshot pages
In the first module, specifically the first track, you added a VMware vCenter Server to your monitored inventory. In the final exercise, you viewed the Quick Snapshot for both the vCenter Server Element and one of its VMs. Because the vCenter Server was just added, there was no data in the graphs. Because the graphs show the last 24 hours of activity, you only need to wait overnight to fully populate them, but even a handful of data-collection cycles can suffice. Let's revisit these pages.
- Click Infrastructure.
- Click the vCenter Server's gear icon, then in the pop-up menu, click Graph Performance to display its Quick Snapshot.
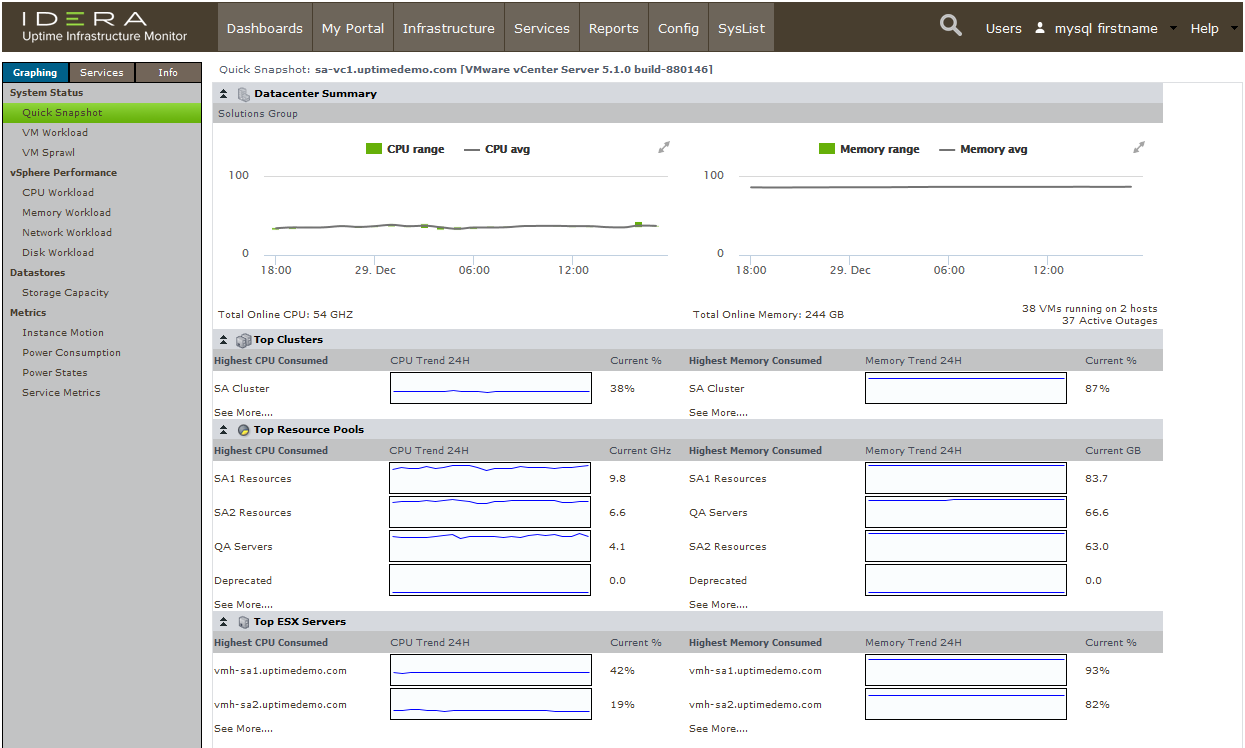
The this example, there is a full day's worth of data displayed for a same vCenter Server that comprises three datacenters. The top CPU and memory consumers are shown by cluster, ESX host, and resource pool; you should now see some ranked vCenter Server objects, accompanied by historical graphs. - Click Infrastructure to return to the main inventory view.
Expand the Discovered Virtual Machines Infrastructure Group, and click the gear icon for any of the VMs (preferably the same one you selected back in the first module). In the pop-up menu, again, click Graph Performance to display that Element's Quick Snapshot.
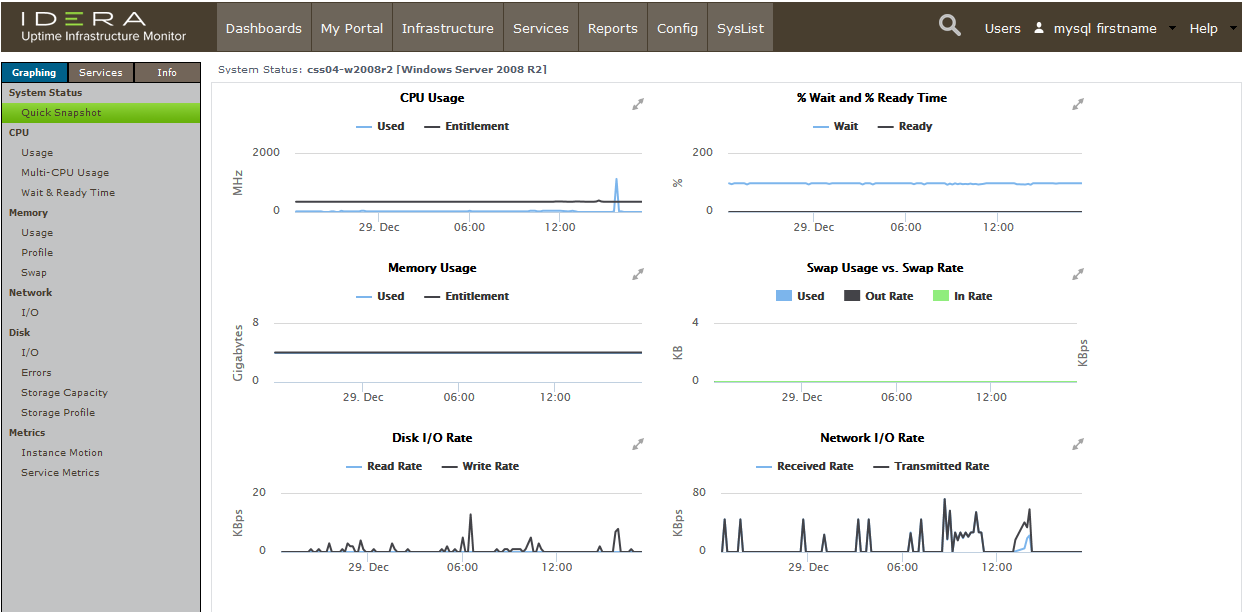
The key performance and resource metrics for the VM should now show some usage and baselines.Section border true Column width 50% Back: Organize Users and Views Column width 50%
