| Table of Contents | ||
|---|---|---|
|
Overview
By generating graphs, you can display performance and usage statistics for up.time Uptime Infrastructure Monitor Elements. Generating graphs helps you diagnose problems through root-cause analysis, as well as review the overall health and performance of monitored Elements. With vSync (VMware) and Sync (Hyper-V), you can generate graphs for VMware vSphere virtual server components that are being monitored by up.timeUptime Infrastructure Monitor, allowing you to diagnose and review all components of your infrastructure—whether virtual assets or physical ones—from the same view.
When viewing the Graphing tab for any VMware vSphere virtual component, you will see different graphing options depending on the type of VMware vSphere object, or in the case of VMs, the operating system that is running.
Viewing the Status of a
vSphereVirtual Element
You can view the status of your VMware vCenter servers, Hyper-V host servers, ESX servers, and VMs using Quick Snapshots. The Quick Snapshot summarizes both the recent and current performance of key hardware and process information for a VMware vSphere virtual component that exists in up.time Uptime Infrastructure Monitor as an Element, and can help administrators identify potential issues.
| Info |
|---|
If there are is not 24 hours’ hours worth of data available, up.time will use Uptime Infrastructure Monitor uses data from as far back as possible to generate charts. |
- Hyper-V Host Server
- VMware vCenter server
- ESX server or cluster
- virtual machine
- virtual machine using WMI or the up.time Uptime Infrastructure Monitor agent to collect metrics
The Quick Snapshot is typically used as a preliminary step toward root cause analysis. When you first acknowledge an issue by clicking an Element name on either Global Scan, or the My Alerts section of My Portal, you are shown the Quick Snapshot for that Element. From here, you can work with the information provided in the charts and tables and begin further investigation:
- clicking the expand arrow at the top-right of a chart enlarges it
- in the enlarged chart, click-dragging a start and end point along the timeline expands that specific range
- when viewing an enlarged chart, you print or export it by clicking the context menu icon at the top-right, then making the appropriate choice
- at any zoom range, hovering the mouse pointer along the timeline displays the value for that precise interval
- when more than one metric is displayed, clicking metrics in the legend toggles them on and off, allowing you to focus on a specific metric
Virtual Server Quick Snapshot Contents
The following information is displayed in a VMware vCenter server Quick Snapshot:
Datacenter Summary | ||
datacenters that are |
monitored are listed in alphabetical order, along with resource information for the datacenter as a whole | ||
CPU Capacity Trend |
| |
Memory Capacity Trend | ||
| ||
Total Active CPU | the total CPU cycles, in GHz, that are available, whether they are currently | |
used | ||
Total Active Memory | the total available memory, in GB, that is available, whether it is currently in use | |
Running VMs and Hosts Count | ||
| ||
Active Outages | ||
| ||
| ||
Top Clusters / Top ESX Servers | ||
the top five clusters and ESX servers are respectively listed in order of current CPU usage | ||
CPU Trend 24h | the CPU usage trend of the cluster or ESX server over the last 24 hours, expressed as a percentage of total available CPU cycles | |
clicking opens a pop-up displaying a CPU Workload graph showing actual CPU usage over the last 24 hours | ||
Current % | the current percentage of total available CPU cycles | |
consumed by the cluster or ESX server | ||
the top five clusters and ESX servers are respectively listed in order of memory used | ||
Memory Trend 24h | the memory usage trend of the cluster or ESX server over the last 24 hours, expressed as a percentage of total available memory | |
clicking opens a pop-up displaying a Memory Workload graph showing actual memory usage over the last 24 hours | ||
Current GB | the current percentage of total available memory currently | |
used by the cluster or ESX server | ||
Top Resource Pools | ||
the top five resource pools are listed in order of current CPU usage | ||
CPU Trend 24h | the CPU usage trend of the resource pool over the last 24 hours, expressed in raw GHz | |
clicking opens a pop-up displaying a CPU Workload graph showing actual CPU usage over the last 24 hours | ||
Current GHz | the amount of CPU cycles, in raw GHz, currently consumed by the resource pool | |
the top five resource pools are listed in order of memory used | ||
Memory Trend 24h | the memory usage trend of the resource pool over the last 24 hours, expressed in raw GBs | |
clicking opens a pop-up displaying a Memory Workload graph showing actual memory usage over the last 24 hours | ||
Current GB | the amount of total memory, in raw GB, currently | |
used by the resource pool |
ESX Server and Cluster Quick Snapshot Contents
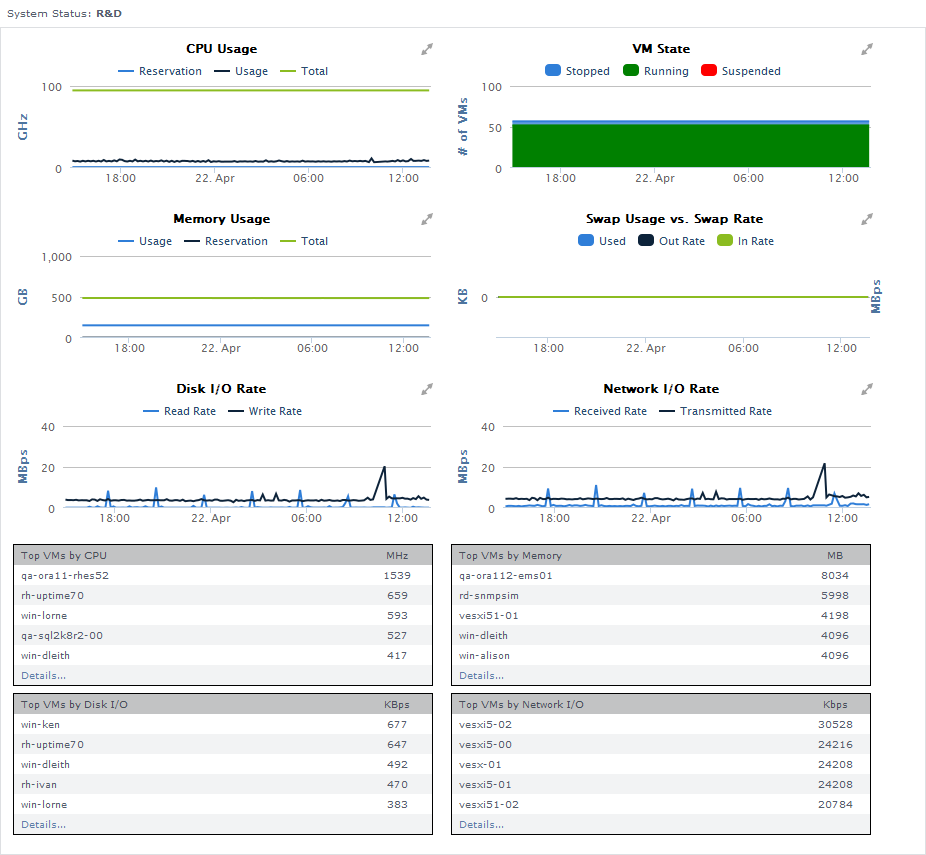
The following information is displayed in an ESX server a Hyper-V host or ESX server or cluster Quick Snapshot:
CPU Usage | the following is shown for the last 24 hours, where the mouse-over segments are in 10-minute intervals:
| |
VM state | the following is shown for the last 24 hours, where the mouse-over segments are in 10-minute intervals:
| |
Memory Usage | the following is shown for the last 24 hours, where the mouse-over segments are in 10-minute intervals:
| |
Swap Usage vs. Swap Rate | the following is shown for the last 24 hours, where the mouse-over segments are in 10-minute intervals:
| |
Disk I/O Rate | the following is shown for the last 24 hours, where the mouse-over segments are in 10-minute intervals:
| |
Network I/O Rate | the following is shown for the last 24 hours, where the mouse-over segments are in 10-minute intervals:
| |
Top VMs by CPU |
| |
Top VMs by Memory |
| |
Top VMs by Disk I/O |
| |
Top VMs by Network I/O |
| |
Virtual Machine Quick Snapshot Contents
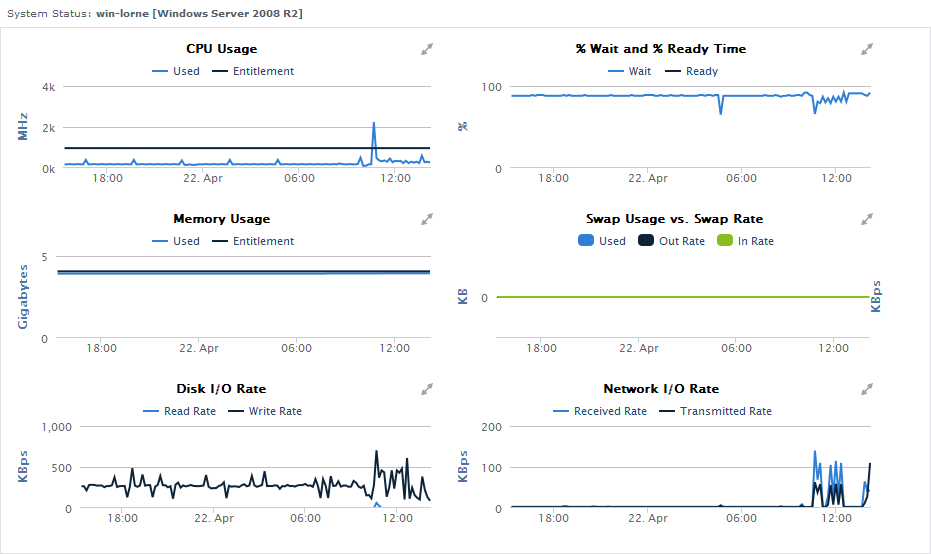
The following information is displayed in a guest virtual machine Quick Snapshot:
CPU Usage | the following is shown for the last 24 hours, where the mouse-over segments are in 10-minute intervals:
| |||
% Wait and % Ready Time (VMware only) | the following is shown for the last 24 hours, where the mouse-over segments are in 10-minute intervals:
| |||
| ||
| ||
| ||
| CPU Wait Time Per Dispatch (Hyper-V only) | the following is shown for the last 24 hours, where the mouse-over segments are in 10-minute intervals:
| |
Memory Usage | the following is shown for the last 24 hours, where the mouse-over segments are in 10-minute intervals:
| |
Swap Usage vs. Swap Rate | the following is shown for the last 24 hours, where the mouse-over segments are in 10-minute intervals:
| |
Disk I/O Rate | the following is shown for the last 24 hours, where the mouse-over segments are in 10-minute intervals:
| |
Network I/O Rate | the following is shown for the last 24 hours, where the mouse-over segments are in 10-minute intervals:
| |
Top 10 Processes | note that this process list is only available if the VM Element’s metrics are | |
reported via WMI or the |
Uptime Infrastructure Monitor Agent
|
Viewing a Quick Snapshot for a
vSphereVirtual Component
To display the Quick Snapshot page for any VMware vSphere virtual component, do the following:
- In the My On the Global Scan dashboard or Infrastructure panel, locate the VMware vCenter, ESX server, or VM click the name of the Element whose Quick Snapshot you would like to view.
- Click the gear icon beside the Element.
- In the Element’s Configure pop-menu, click Graph Performance.
Note that when you are viewing an Element’s profile, you can always access its Quick Snapshot by clicking the Graphing tab, and then clicking Quick Snapshot in the tree panel.
CPU Performance Graphs
up.time Uptime Infrastructure Monitor uses the following graphs to chart the performance of one or more CPUs on a system:
CPU Workload
CPU Workload graphs help you gauge the demand being placed on your computing resources, and understand specifically from where it is coming. For example, for a VMware vCenter server, you can find out which ESX servers or clusters are consuming the most CPU cycles, or for an ESX a Hyper-V host server, which VMs are creating the largest workload.
CPU Workload Metrics
For CPU Workload graphs for a VMware vCenter server, the amount of MHz used can be generated for the following Element types:
- Datacenters
- Clusters
- ESX servers
- virtual machines
- resource pools
- vApps
For CPU Workload graphs for a Hyper-V host or an ESX server, the amount of MHz used can be generated for the following Element types:
- virtual machines
- resource pools
- vApps
Graphing CPU Workload for a
vCenterhost or ESX Server
To generate a CPU Workload graph, do the following:
Go to the Element’s Quick Snapshot page.
For example, in the My Infrastructure panelInfrastructure panel, find the VMware vCenter server or ESX server Element whose workload you want to graph, click its corresponding gear icon, and then click Graph Performance .- In the Tree panel, click CPU Workload (for a VMware vCenter server), or Workload in the CPU section (for an a Hyper-V or ESX server).
- Select and apply the start and end dates and times for which the graph will chart charts data. For For more information about using these fields, see Understanding Dates and Times.
- Click one of the Quick Graphs options to display a pre-configured graph in a pop-up window, or skip this step to manually configure a graph.
- In the first step, select a VMware vSphere component whose metrics will be graphedyou want to graph.
- In the next step, select whether to graph the highest resource consumers, or specific VMware vSphere components.
If you select Specific, an Element selection dialog will appearappears, requiring you to build a list. - Click Generate Graph.
A pop-up window will appearappears, displaying the CPU Workload graph you have configured.
CPU Usage
The CPU Usage graph shows how CPU resources are managed and used across all instances on an a Hyper-V host or ESX server , or an individual VM.
CPU Usage Metrics
The following metrics are displayed in a CPU Usage graph:
Reservation | the minimum amount of CPU resources reserved for the VM, or all VMs running on | |
a host | ||
Entitlement | the amount of CPU resources allocated to a VM, or all VMs running on | |
a host, on the assumption that all VMs on a host are completely busy, and load is perfectly balanced across hosts | ||
Usage MHz | the amount of CPU used, in MHz, by the VM, or all powered on VMs running on the | |
host | ||
Usage % | the amount of CPU resources, as a percentage of total available CPU, used by the cluster, | |
host, or VM | ||
Usage % (agent) | the amount of CPU resources, as a percentage of total available CPU, used by a VM that is reporting detailed metrics via WMI or the | |
Uptime Infrastructure Monitor agent |
Graphing CPU Usage for
ana Hyper-V host, ESX Server, or VM
To generate a CPU Usage graph, do the following:
- Go to the Element’s Quick Snapshot page.
For example, in the My Infrastructure the Infrastructure panel, find the ESX server or VM Element whose CPU usage you want to graph, click its corresponding gear icon, and then click click Graph Performance. - In the Tree panel, click Usage in the CPU section.
- Select and apply the start and end dates and times for which the graph will chart charts data. For more information, see Understanding Dates and Times.
- Select the metrics you want to include in the graph.
- Click Generate Graph.
A pop-up window will appearappears, displaying the CPU Usage graph you have configured.
Multi-CPU Usage
The Multi-CPU Usage graph charts the performance statistics for ESX hosts or VMs with more than one CPU. These statistics indicate whether or not a system is effectively balancing tasks between CPUs, or if processes are being forced off CPUs in certain circumstances. You can also use this graph to determine whether or not there are too many system interrupts that are using a CPU or that are overloading a CPU.
Multi-CPU Usage Metrics
The following metrics are displayed in a Multi-CPU Usage graph:
Hyper-V Host or ESX Server | ||
Usage MHz | usage of total CPU resources by physical cores, as a percentage, on the | |
host | ||
Virtual Machine | ||
Usage MHz | the amount of CPU usage, in MHz, by CPU, on the VM | |
% System Time | the amount, as a percentage, spent on system processes on each vCPU in the VM | |
% Wait Time | the amount, as a percentage, vCPUs on the VM spent in wait state | |
% Used | the amount, as a percentage, of used vCPU time | |
Virtual Machine with WMI- or Agent-Based Metrics | ||
% Total | total amount of user, privileged, and interrupt time, by vCPU | |
% Usr | the amount of time, as a percentage, of user processes, by vCPU | |
% Sys | the amount of time, as a percentage, of system process use, by vCPU | |
% Wait | the amount of time, as a percentage, of wait time use | |
Interrupts | number of CPU interrupts | |
| Info |
|---|
For the % Wait metric, it is possible that you will see It is possible to be presented with values that exceed 100%. The underlying data used for the CPU in these graphs are migrated from VMware vSphere via vSync/Sync; VMware and Hyper-V conventions include percent-based metrics that can be greater than 100%. For example, refer to the VMware Technical Note, Performance Counters, at http://www.vmware.com/files/pdf/technote_PerformanceCounters.pdf. and the MSDN article, Measuring Performance on Hyper-V. |
Graphing Multi-CPU Usage for
ana Hyper-V host, ESX Server, or VM
To generate a multi-CPU usage graph, do the following:
- Go to the Element’s Quick Snapshot page.
For example, in the My Infrastructure the Infrastructure panel, find the ESX server or VM Element whose multi-CPU workloads you want to graph, click its corresponding gear icon, and then click click Graph Performance. - In the CPU section of the Tree panel, click Multi-CPU Usage.
- Select and apply the start and end dates and times for which the graph will chart data, then click Apply Date and Time . For
- charts data. For more information, see Understanding Dates and Times.
- In the next step, select whether to graph the highest resource consumers, or specific VMs.
If you select Specific, an Element selection dialog will appearappears, requiring you to build a list. - Click Generate Graph.
A pop-up window will appearappears, displaying the Multi-CPU Workload graph you have configured.
Wait and Ready Time (VMware only)
- CPU wait time is the amount of time a VM is given scheduled time, but there is nothing to process, resulting in an idle CPU.
- CPU ready time is the amount of time that a VM is ready for processing, but could not get scheduled to run on the physical CPU.
The Wait and Ready Time graph helps you determine if a guest is waiting too often on a host, or a host is waiting too often on a guest.
Wait and Ready Time Metrics
The following metrics are displayed in a Wait and Read Time graph:
% Wait | the amount of time during the interval, as a percentage, that the VM or all VMs on | |
a host, resource pool or vApp had scheduled CPU time, but gave nothing to process | ||
% Ready | the amount of time during the interval, as a percentage, that the VM or all VMs on | |
a host, resource pool or vApp were ready to process, but were not scheduled CPU time by the host |
| Info |
|---|
For these metrics, it It is possible to be presented with values that exceed 100%. The underlying data used in these graphs are migrated from VMware vSphere via vSync/Sync; VMware and Hyper-V conventions include percent-based metrics that can be greater than 100%. For example, refer to the VMware Technical Note, Performance Counters, at http://www.vmware.com/files/pdf/technote_PerformanceCounters.pdf and the MSDN article, Measuring Performance on Hyper-V. |
Graphing Wait and Ready Time for
an ESX Servera vCenter server or VM
To generate a percent-wait or percent-ready graph, do the following:
- Go to the Element’s Quick Snapshot page.
For example, in the My Infrastructure the Infrastructure panel, find the ESX server or VM Element whose wait and ready time you want to graph, click its corresponding gear icon, and then click click Graph Performance. - In the CPU section of the Tree panel, click Wait & Read Ready Time.
- Select and apply the start and end dates and times for which the graph will chart data, and click Apply Date and Time . For more informationcharts data. For more information about these fields, see Understanding Dates and Times
- Click one of the Quick Graphs options to display a pre-configured graph in a pop-up window, or skip this step to manually configure a graph.
- In the first step, select a VMware vSphere component whose metrics will be graphedyou want to graph.
- In the next step, select whether to graph the highest resource consumers, or specific VMware vSphere components.
If you select Specific, an Element selection dialog will appearappears, requiring you to build a list. - Choose either the % Wait , or % Ready metric to include in the graph.
- Click Generate Graph.
A pop-up window will appearappears, displaying the CPU Wait and Ready Time graph you have configured.
Graphing Wait and Ready Time for an Agent-Based VM
To generate a percent-wait or percent-ready graph for a VM that receives metrics via WMI or the up.time Uptime Infrastructure Monitor agent, do the following:
- Go to the Element’s Quick Snapshot page.
For example, in the My Infrastructure the Infrastructure panel, find the VM Element whose wait and ready time you want to graph, click its corresponding gear icon, and then click click Graph Performance. - In the CPU section of the Tree panel, click Wait & Ready Time in the CPU section.
- Select and apply the start and end dates and times for which the graph will chart charts data. For more information about these fields, see Understanding Dates and Times
- Select one of or both of the % Ready and % Wait metrics to include in the graph.
- Click Generate Graph.
A pop-up window will appearappears, displaying the graph you have configured.
CPU Wait Time Per Dispatch (Hyper-V only)
The CPU Wait Time Per Dispatch graph charts the average time (in nanoseconds) spent waiting for a Hyper-V virtual processor to be dispatched onto a logical processor using the metric CPUWaitTimePerDispatch. This graph helps you determine if a guest is waiting too often on a host, or a host is waiting too often on a guest.
Graphing CPU Wait Time Per Dispatch for a Hyper-V host
To generate a CPU Wait Time per Dispatch graph for a Hyper-V host, do the following:
- Go to the Element’s Quick Snapshot page.
For example, in the Infrastructure panel, find the Element whose wait and ready time you want to graph, click its corresponding gear icon, and then click Graph Performance. - In the CPU section of the Tree panel, click CPU Wait Time Per Dispatch.
- Select and apply the start and end dates and times for which the graph charts data. For more information about these fields, see Understanding Dates and Times.
- Click one of the Quick Graphs options to display a pre-configured graph in a pop-up window, or skip this step to manually configure a graph.
- In the first step, select a component whose metrics you want to graph.
- In the next step, select whether to graph the highest resource consumers, or specific components. If you select Specific, an Element selection dialog appears, requiring you to build a list.
- Click Generate Graph.
A pop-up window appears, displaying the graph you have configured.
Memory Usage Graphs
Uptime Infrastructure Monitor uses the following graphs to chart memory usage for a system:
Memory
Memory Usage Graphs
up.time uses the following graphs to chart memory usage for a system:
Workload
Memory Workload graphs help you gauge the demand being placed on the memory allocated to your physical and virtual, and understand specifically from where it is coming. For example, for a VMware vCenter server, you can find out which ESX servers or clusters have been are using the most memory, or for an ESX server, which VMs are the recipients of overcommitted over committed, granted memory.
Memory Workload Metrics
The following metrics can be used to generate a Memory Workload graph:
VMware vCenter Server | ||
Consumed | the amount of memory, in MB, that is used by or reserved for a VM, or all VMs that are part of a resource pool or vApp, or the total physical memory used by the datacenter, cluster, or ESX host | |
Ballooned | the amount of guest physical memory | |
reclaimed through ballooning from a VM, or all VMs that are part of a resource pool or vApp, or the total memory balloon for all VMs in a datacenter, cluster, or ESX host | ||
Hyper-V Host or ESX Server | ||
Usage | the amount of memory used, as a percentage of total available memory, by all VMs on the ESX host, or in a resource pool or vApp | |
Active | the estimated amount of active memory in use, in KB, by VMs, or all VMs in a resource pool or vApp | |
Consumed | the amount of memory, in MB, that issued by or reserved for a VM, or all the VMs that are part of a resource pool or vApp | |
Granted | the amount of physical memory allocated to machine memory for a VM, or all the VMs that are part of a resource pool or vApp | |
Ballooned | the amount of guest physical memory | |
reclaimed through ballooning from a VM, or all VMs that are part of a resource pool or vApp |
Graphing Memory Workload for a
vCenterhost or ESX Server
To generate a Memory Workload graph, do the following:
- Go to the Element’s Quick Snapshot page.
For example, in the My Infrastructure the Infrastructure panel, find the VMware vCenter server or ESX server whose workload Element whose multi-CPU workloads you want to graph, click its corresponding gear icon, and then click click Graph Performance. - In the Tree panel, click Memory Workload (for a VMware vCenter server), or Workload in the Memory section (for an a Hyper-V host or ESX server).
- Select and apply the start and end dates and times for which the graph will chart charts data. For more information about these fields, see Understanding Dates and Times.
- Click one of the Quick Graphs options to display a pre-configured graph in a pop-up window, or skip this step to manually configure a graph.
- In the first step, select a VMware vSphere component whose metrics will be graphedyou want to graph.
- In the next step, select whether to graph the highest resource consumers, or specific VMware vSphere components.
If you select Specific, an Element selection dialog will appearappears, requiring you to build a list. - Select the metric to include in the graph.
- Click Generate Graph.
A pop-up window will appearappears, displaying the Memory Workload graph you have configured.
Memory Usage
The Memory Usage graph displays the amount of memory being used on an a Hyper-V host or ESX server, or a VM.
Memory Usage Metrics
The following metrics are displayed in a Memory Usage graph:
Hyper-V Host or ESX Server Metrics |
ESX Server Metrics
Reservation
the minimum amount of memory reserved for VMs running on an ESX host
Consumed
the amount of memory, in MB, that is used by or reserved for VMs running on an ESX host
Active
the estimated amount of active memory in use, in MB, by VMs running on an ESX host
Granted
the amount of memory allocated to VMs running on an ESX host, on the assumption that all are completely busy, and load is perfectly balanced across hosts
Reservation | the minimum amount of memory reserved for | |
Entitlement
VMs running on a host |
Consumed | the amount of memory, in MB, that is used by or reserved for VMs running on a | |
host | ||
Active | the estimated amount of active memory in use, in MB, by | |
VMs running on a host | ||
Granted | the amount of | |
memory allocated to |
Used MB (Agent)
the amount of memory used by a VM that is reporting detailed metrics via WMI or the up.time agent
Graphing Memory Usage for an ESX server or VM
To generate a Memory Usage graph, do the following:
- Go to the Element’s Quick Snapshot page.
For example, in the My Infrastructure panel, find the ESX server or VM whose memory usage you want to graph, click its corresponding gear icon, then click Graph Performance . - In the Tree panel, click Usage in the Memory section.
- Select the start and end dates and times for which the graph will chart data. For more information, see Understanding Dates and Times
- Select the metrics you want to include in the graph.
- Click Generate Graph .
A pop-up window will appear, displaying the Memory Usage graph you have configured.
Memory Profile
The Memory Profile graph displays trends in allocated memory for VMs on an ESX server. Use this graph to ensure VMware vSphere’s memory resource management techniques are working correctly.
Memory Profile Metrics
The following metrics are displayed in a Memory Profile graph:
ESX Server Metrics | ||
Shared Common | the amount of machine memory that is shared by all powered on VMs on the ESX host | |
Swapped | the total amount of guest physical memory swapped out to swap files of all VMs running on the ESX host | |
Ballooned | the total memory balloon of all powered on VMs | |
Overhead | the total amount of machine memory used to run all VMs running on the ESX host | |
VM metrics | ||
Shared | the amount of guest physical memory shared with other VMs | |
Swapped | the amount of guest physical memory swapped out to the VMs swap file | |
Ballooned | the amount of guest physical memory being reclaimed through ballooning from a VM | |
Overhead | the amount of machine memory used to run the VM | |
Graphing a Memory Profile for an ESX Server or VM
To generate a Memory Profile graph, do the following:
- Go to the Element’s Quick Snapshot page.
For example, in the My Infrastructure panel, find the ESX server or VM whose Memory Profile graph you want to create, click its corresponding gear icon, then click Graph Performance . - In the Tree panel, click Profile in the Memory section.
- Select the start and end dates and times for which the graph will chart data. For more information, see Understanding Dates and Times
- Select the metrics you want to include in the graph.
- Click Generate Graph .
A pop-up window will appear, displaying the Memory Profile graph you have configured.
VMs running on a host, on the assumption that all are completely busy, and load is perfectly balanced across hosts | ||
VM metrics | ||
Reservation | the minimum amount of memory reserved for the VM | |
Entitlement | the amount of memory, in MB, allocated to a VM, on the assumption that all VMs on a host are completely busy, and load is perfectly balanced across hosts | |
Consumed | the amount of memory, in MB, that is used by or reserved for a VM | |
Active | the estimated amount of active memory in use, in MB, by the VMs | |
Granted | the amount of physical memory allocated to machine memory for a VM | |
Used MB (Agent) | the amount of memory used by a VM that is reporting detailed metrics via WMI or the Uptime Infrastructure Monitor agent | |
Graphing Memory Usage for a Hyper-V host, ESX server, or VM
To generate a Memory Usage graph, do the following:
- Go to the Element’s Quick Snapshot page.
For example, in the Infrastructure panel, find the Element whose memory usage you want to graph, click its corresponding gear icon, and then click Graph Performance. - In the Tree panel, click Usage in the Memory section.
- Select and apply the start and end dates and times for which the graph charts data. For more information about these fields, see Understanding Dates and Times.
- Select the metrics you want to include in the graph.
- Click Generate Graph.
A pop-up window appears, displaying the Memory Usage graph you have configured.
Memory Profile
The Memory Profile graph displays trends in allocated memory for VMs on a Hyper-V host or ESX server. Use this graph to ensure the memory resource management techniques are working correctly.
Memory Profile Metrics
The following metrics are displayed in a Memory Profile graph:
Hyper-V Host or ESX Server Metrics | ||
Shared Common | the amount of machine memory that is shared by all powered on VMs on the host | |
Swapped | the total amount of guest physical memory swapped out to swap files of all VMs running on the host | |
Ballooned | the total memory balloon of all powered on VMs | |
Overhead | the total amount of machine memory used to run all VMs running on the host | |
VM metrics | ||
Shared | the amount of guest physical memory shared with other VMs | |
Swapped | the amount of guest physical memory swapped out to the VMs swap file | |
Ballooned | the amount of guest physical memory reclaimed through ballooning from a VM | |
Overhead | the amount of machine memory used to run the VM | |
Graphing a Memory Profile for a Hyper-V Host, ESX Server, or VM
To generate a Memory Profile graph
Memory Guest Paging
This graph indicates whether or not a VM guest is short of memory.
Guest Paging Metrics
The following metrics are displayed in a Guest Paging graph:
Page In/sec | number of memory pages transferred from disk to RAM | |
Page Out/sec | number of memory pages transferred from RAM to disk | |
Page Frees/sec | number of memory pages removed from being swapped to and from RAM and secondary storage | |
Graphing Guest Memory Paging Rates on an Agent-Based VM
To generate a guest memory paging rate graph for a VM that receives metrics via WMI or from the up.time agent, do the following:
- Go to the Element’s Quick Snapshot page.
For example, in the My Infrastructure the Infrastructure panel, find the VM Element whose paging rates Memory Profile you want to creategraph, click its corresponding gear icon, and then click click Graph Performance. - In the Memory section of the Tree panel, click Guest Paging Profile in the Memory section.
- Select and apply the start and end dates and times for which the graph will chart charts data. For more information about these fields, see Understanding Dates and Times.
- Select the paging metrics you want to include in the graph.
- Click Generate Graph.
A pop-up window will appear - appears, displaying the Memory Profile graph you have configured.
Memory Swap
The Memory Swap graph charts the amount of memory held in swap files on Hyper-V host or ESX servers, as well as the rates at which data is swapping between memory and secondary storage.
Memory Swap Metrics
The following metrics are displayed in a Memory Swap graph:
Hyper-V Host or ESX Server Metrics | ||
Swapped | total guest physical memory, in MB, swapped out to swap files of VMs in resource pools, vApps, or on the | |
host | ||
Swap Total Rate | the total swap in rate and swap out rate, in MB, for VMs in resource pools, vApps, or on the | |
host | ||
VM Metrics | ||
Swap Used | the amount of guest physical memory, in MB, swapped out to the VM’s swap file | |
Swap In Rate | the rate at which memory, in MB, is swapped into active memory | |
Swap Out Rate | the rate at which memory, in MB, is | |
swapped out to disk | ||
Swap Used MB (Agent) | the amount of guest physical memory, in MB, swapped out to the VM’s swap file, as reported via WMI or the | |
Uptime Infrastructure Monitor agent |
Creating a Memory Swap Graph for
ana Hyper-V host, ESX server, or VM
To generate a percent-wait or percent-ready graph, do the following:
- Go to the Element’s Quick Snapshot page.
For example, in the My Infrastructure the Infrastructure panel, find the ESX server or VM Element whose memory swap statistics you want to graph, click its corresponding gear icon, and then click click Graph Performance. - In the Memory section of the Tree panel, click Swap.
- Select and apply the start and end dates and times for which the graph will chart data, and click Apply Date and Time . For more informationcharts data. For more information about these fields, see Understanding Dates and Times.
- Click one of the Quick Graphs options to display a pre-configured graph in a pop-up window, or skip this step to manually configure a graph.
- In the first step, select a VMware vSphere component whose metrics will be graphedyou want to graph.
- In the next step, select whether to graph the highest resource consumers, or specific VMware vSphere components.
If you select Specific, an Element selection dialog will appearappears, requiring you to build a list. - Select the metric you wish to include in the graph.
- Click Generate Graph.
A pop-up window will appearappears, displaying the Memory Swap graph you have configured.
Creating a Memory Swap Graph for an Agent-Based VM
To generate a Memory Swap graph for a VM that receives metrics via WMI or the up.time Uptime Infrastructure Monitor agent, do the following:
- Go to the Element’s Quick Snapshot page.
For example, in the My Infrastructure the Infrastructure panel, find the VM Element whose memory swap information you want to graph, click its corresponding gear icon, and then click click Graph Performance. - In the Tree panel, click Swap in the Memory section.
- Select and apply the start and end dates and times for which the graph will chart charts data. For more information about these fields, see Understanding Dates and Times.
- Select the metrics you want to include in the graph.
- Click Generate Graph.
A pop-up window will appearappears, displaying the Memory Swap graph you have configured.
Process Graphs
up.time Uptime Infrastructure Monitor uses the following graphs to report system process information for VMware vSphere- monitored VMs virtual machines whose metrics are reported via WMI or with the up.time Uptime Infrastructure Monitor agent:
Process Workload
The Process Workload graph determines the demand that network and local services are putting on a VM whose metrics are reported via WMI or with the up.time Uptime Infrastructure Monitor agent. The graph charts an aggregate amount of performance information for a given user, group, or process.
Process Workload Metrics
The following metrics are displayed in a Process Workload graph:
% CPU | the percentage of the VM’s CPU time that is taken up by a user, group, or process | |
Total Memory Size |
| |
RSS Memory Size |
| |
|
Graphing Process Workloads for an Agent-Based VM
To generate a Process Workload graph for a VM that receives metrics via WMI or the up.time Uptime Infrastructure Monitor agent, do the following:
- Go to the Element’s Quick Snapshot page.
For example, in the My Infrastructure the Infrastructure panel, find the VM Element whose process workload you want to graph, click its corresponding gear icon, and then click click Graph Performance. - In the Process section of the Tree panel, click Workload.
- Select and apply the start and end dates and times for which the graph will chart data, and click Apply Date and Time charts data. For more information about these fields, see Understanding Dates and Times.
- Click one of the Quick Graphs options to display a pre-configured workload graph in a pop-up window, or skip this step to manually configure a graph.
- In the first step, select an object whose workload will be graphedyou want to graph.
- In the next step, select whether to graph the highest resource consumers, or specific processes running on the VM.
If you select Specific, a process selection dialog will appearappears, requiring you to build a list. - Select one or more process metrics to include in the graph.
- Click Generate Graph.
A pop-up window will appearappears, displaying the Process Workload graph you have configured.
Detailed Process Information
Detailed process information provides insight into how various user and system processes are consuming system resources.
Detailed Process Information Statistics
The following information is displayed in a Detailed Process Information table:
Process | the name of the process, which is taken from its executed path name | |
PID | the number that identifies the process | |
PPID |
| |
UID |
| |
| ||
GID |
| |
| ||
Memory Used |
| |
| ||
RSS |
| |
| ||
CPU % |
| |
Mem % | the percentage of the memory used by the process | |
Runtime | the total runtime of the process | |
Children Runtime | the runtime of all child processes | |
Start Time | the time at which the process started, which can be used to determine its lifetime | |
Listing Detailed Process Information for an Agent-Based VM
To list Detailed Process Information for a VM Element, do the following:
- Go to the Element’s Quick Snapshot page.
For example, in the My Infrastructure the Infrastructure panel, find the VM Element whose process information you want to displaygraph, click its corresponding gear icon, and then click click Graph Performance. - In the Tree panel, click Detailed Proc InfoProcess Information in the Process section.
- Select and apply the start and end dates and times for which the graph will chart charts data. For more information about these fields, see Understanding Dates and Times.
- Click Display Process Information.
A pop-up window will appearappears, displaying the process information for the specified time interval.
Number of Processes
The Number of Processes graph displays the VM’s process activity with the following details:
- number of processes
- running processes
- blocked processes
- waiting processes
Analyzing processes helps you determine whether or not there is enough CPU capacity for the processes that are being run on a system. If the size of the blocked or waiting queue is disproportionate to the running queue, then either the system does not have enough CPUs or is too I/O bound.
A blocked process signals a disk bottleneck. If the number of blocked processes approaches or exceeds the number of processes in the run queue, you should tune the disk subsystem. Whenever there are any blocked processes, all CPU idle time is treated as wait for I/O time. If database batch jobs are running on the system that is being monitored, there will always be are some blocked processes. However, you can increase the throughput of batch jobs by removing disk bottlenecks.
Process Count Statistics
The following WMI- or agent-based information is displayed in a Process Count table:
Running | the number of processes that are currently running on a system, as reported by the system kernel | |
Blocked | the number of processes that are unable to complete, usually due to I/O operation | |
Waiting | the number of processes awaiting execution | |
Total Processes | the total number of running, blocked, and waiting processes | |
Graphing Process Counts for an Agent-Based VM
To generate a Number of Processes graph, do the following:
- Go to the Element’s Quick Snapshot page.
For example, in the My Infrastructure the Infrastructure panel, find the VM Element whose process counts you want to graph, click its corresponding gear icon, and then click click Graph Performance. - In the Process section of the Tree panel, click Number of Processes.
- Select and apply the start and end dates and times for which the graph will chart charts data. For more information about these fields, see Understanding Dates and Times.
- Select the metrics you want to include in the graph.
- Click Generate Graph.
A pop-up window will appearappears, displaying the process counts graph you have configured.
Network Graphs
up.time Uptime Infrastructure Monitor uses the following graphs to chart network performance and usage:
Network Workload
Network Workload graphs help you gauge the demand being placed on the network, and understand specifically from where it is coming. For example, for a VMware vCenter server, you can find out which ESX servers or clusters are transmitting and receiving the most data, or for an ESX server, which VMs’ virtual NICs are the busiest.
Network Workload Metrics
For Network Workload graphs for a VMware vCenter server, the sum of KBps transmitted and received through NICs and vNICs can be generated for the following Element types:
- Datacenters
- Clusters
- ESX servers
- virtual machines
- resource pools
- vApps
For Network Workload graphs for an a Hyper-V host or ESX server, the sum of KBps transmitted and received through virtual NICs can be generated for the following Element types:
- virtual machines
- resource pools
- vApps
Graphing Network Workload for a vCenter, Hyper-V host, or ESX Server
To generate a Network Workload graph, do the following:
- Go to the Element’s Quick Snapshot page.
For example, in the My Infrastructure the Infrastructure panel, find the VMware vCenter server or ESX server Element whose workload you want to graph, click its corresponding gear icon, and then click click Graph Performance. - In the Tree panel, click Network Workload (for a VMware vCenter server), or Workload in the Network section (for an a Hyper-V host or ESX server).
- Select and apply the start and end dates and times for which the graph will chart charts data. For more information about these fields, see Understanding Dates and Times.
- Click one of the Quick Graphs options to display a pre-configured graph in a pop-up window, or skip this step to manually configure a graph.
- In the first step, select a VMware vSphere component whose metrics will be graphedyou want to graph.
- In the next step, select whether to graph the highest resource consumers, or specific VMware vSphere components.
If you select Specific, an Element selection dialog will appearappears, requiring you to build a list. - Click Generate Graph.
A pop-up window will appearappears, displaying the Network Workload graph you have configured.
Network I/O
The I/O graph displays rates and total sums of data that are moving in and out of physical and virtual network interfaces over a specified time period. It can be used to find where I/O bottlenecks are occurring, and whether there have been are any bursts in network traffic.
Network I/O Metrics
The following metrics are displayed in a Network I/O graph:
Hyper-V Host or ESX Server Metrics | ||
Total Rate | the sum of data transmitted and data received, in KBps, through the physical NICs on the | |
host | ||
Transmit Rate | the average rate, in KBps, at which data was transmitted through each physical NIC on the | |
host | ||
Receive Rate | the average rate, in KBps, at which data was received through each physical NIC on the | |
host | ||
VM Metrics | ||
Total Rate | the sum of data transmitted and data received, in KBps, through the vNICs on the VMs on the | |
host | ||
Transmit Rate | the average rate, in KBps, at which data was transmitted through each vNIC on the VM | |
Receive Rate | the average rate, in KBps, at which data was received through each vNIC on the VM | |
Total Rate (Agent) | the sum of data transmitted and data received, in KBps, through the guest NICs on the VMs on the | |
host, as reported via WMI or the |
Uptime Infrastructure Monitor agent | ||
Send Rate (Agent) | the average rate, in KBps, at which data was transmitted through the guest NICs on the VMs on the | |
host, as reported via WMI or the |
Uptime Infrastructure Monitor agent | ||
Receive Rate (Agent) | the average rate, in KBps, at which data was received through the guest NICs on the VMs on the | |
host, as reported via WMI or the |
Uptime Infrastructure Monitor agent |
Graphing Network I/O Rates for
ana Hyper-V Host, ESX Server, or VM
To generate a Network I/O graph for an ESX server or VM, do the following:
- Go to the Element’s Quick Snapshot page.
For example, in the My Infrastructure the Infrastructure panel, find the ESX server or VM Element whose network rates you want to graph, click its corresponding gear icon, and then click click Graph Performance. - In the Network section of the Tree panel, click I/O.
- Select and apply the start and end dates and times for which the graph will chart data, and click Apply Date and Time charts data. For more information about these fields, see Understanding Dates and Times.
- If you are graphing network I/O for a VM that receives metrics via WMI or from the up.time Uptime Infrastructure Monitor agent, select whether to graph network rates through virtual NICs or guest NICs.
- In the next step, select whether to graph the highest resource consumers, or specific VMware vSphere components.
If you select Specific, an Element selection dialog will appearappears, requiring you to build a list. - Select the network metric to include in the graph.
- Click Generate Graph.
- A pop-up window will appearappears, displaying the network I/O rate graph you have configured.
Network Errors
The Network Errors graph displays the rate of errors with physical NICs on Hyper-V host or ESX servers, and vNICs on VMs.
The most common types of errors for physical connections include collisions in a hubbed environment or the presence of full-duplex handshake errors between a system and a switch. Additionally, the following communication line problems can cause network errors:
- excessive noise
- cabling problems
- problems with backbone connections
Network Error Metrics
The following metrics are displayed in a Network Errors graph
Hyper-V Host or ESX Server Metrics | ||
Total Dropped/min | the total number of dropped packets through the physical NICs on the | |
host, per minute, during the time period | ||
Transmit Dropped/min | the number of packets outbound through the physical NICs on the | |
host that were dropped per minute during the time period | ||
Receive Dropped/min | the number of packets inbound through the physical NICs on the | |
host that were dropped per minute during the time period | ||
VM metrics | ||
Total Errors (Agent) | the sum of in errors and out errors through a guest NIC on the VMs on the | |
host | ||
In Errors (Agent) | the number of packets received, but unable to be decoded due to a missing header or trailer | |
Out Errors (Agent) | the number of packets that were not sent, due to problems transmitting the packet or formatting the packet for transmission | |
Collisions (Agent) | the simultaneous presence of signals from two nodes on the network (e.g., from two nodes beginning to transmit over a network at the same time) | |
TCP Retransmits (Agent) | the number of TCP retransmits that occurred during the time period, due to lost or broken packets | |
Graphing Network Error Rates for
ana Hyper-V Host, ESX Server, or VM
To generate a network error graph, do the following:
- Go to the Element’s Quick Snapshot page.
For example, in the My Infrastructure the Infrastructure panel, find the ESX server or VM Element whose network error rate you want to graph, click its corresponding gear icon, and then click click Graph Performance. - In the Network section of the Tree panel, click Errors.
- Select and apply the start and end dates and times for which the graph will chart data, and click Apply Date and Time charts data. For more information about these fields, see Understanding Dates and Times.
- In the next step, select whether to graph the highest resource consumers, or specific VMware vSphere components.
If you select Specific, an Element selection dialog will appearappears, requiring you to build a list. - Select the error metric to include in the graph.
- Click Generate Graph.
A pop-up window will appearappears, displaying the network error rate graph you have configured.
Disk Graphs
up.time Uptime Infrastructure Monitor uses the following graphs to chart disk details, performance, and usage:
Disk Workload
Disk Workload graphs help you gauge the demand being placed on your physical or guest storage, and understand specifically from where it is coming. For example, for a VMware vCenter server, you can find out which ESX servers are experiencing the heaviest disk read/write activity, or for an ESX server, which VMs are writing the most to disk, prompting further investigation into VM read and write rates.
Disk Workload Metrics
For Disk Workload graphs for a VMware vCenter server, the aggregated disk I/O rate, in KBps, can be generated for the following Element types:
- Datacenters
- Clusters
- ESX servers
- virtual machines
- resource pools
- vApps
For Disk Workload graphs for an a Hyper-V host or ESX server, the aggregated disk I/O rate, in KBps, can be generated for the following Element types:
- virtual machines
- resource pools
- vApps
Graphing Disk Workload for a vCenter, Hyper-V Host, or ESX Server
To generate a Disk Workload graph, do the following:
- Go to the Element’s Quick Snapshot page.
For example, in the My Infrastructure the Infrastructure panel, find the VMware vCenter server or ESX server Element whose workload you want to graph, click its corresponding gear icon, and then click click Graph Performance. - In the Tree panel, click Disk Workload (for a VMware vCenter server), or Workload in the Disk section (for an a Hyper-V host or ESX server).
- Select and apply the start and end dates and times for which the graph will chart charts data. For more information about these fields, see Understanding Dates and Times.
- Click one of the Quick Graphs options to display a pre-configured graph in a pop-up window, or skip this step to manually configure a graph.
- In the first step, select a VMware vSphere component whose metrics will be graphedyou want to graph.
- In the next step, select whether to graph the highest resource consumers, or specific VMware vSphere components.
If you select Specific, an Element selection dialog will appearappears, requiring you to build a list. - Click Generate Graph.
A pop-up window will appearappears, displaying the Disk Workload graph you have configured.
Disk I/O
The Disk I/O charts the rates at which physical disks on Hyper-V host or ESX servers, and virtual disks on VMs are reading and writing data. VMs that are receiving metrics via WMI or the up.time Uptime Infrastructure Monitor agent report deeper metrics including wait times and data transfer speeds. These metrics can help you determine which disks are busiest.
Disk I/O Metrics
The following metrics are displayed in a Disk I/O graph:
Hyper-V host, ESX server, and VM Element Metrics | ||
Total RW Rate | the total read rate and write rate for virtual disks on VM, or LUNs on the | |
host | ||
Read Rate | the rate, in KBps, at which data is read from each virtual disk on the VM, or each LUN on the | |
host | ||
Write Rate | the rate, in KBps, at which data is written to each virtual disk on the VM, or each LUN on the | |
host | ||
Total RW/min | the total number of read requests and write request from each virtual disk on the VM, or LUN on | |
the host | ||
Read Requests/min | the number of times data was read from each virtual disk on the VM, or LUN on the | |
host | ||
Write Requests/min | the number of times data was written to each virtual disk on the VM, or LUN on the | |
host | ||
VM w/ agent Metrics on Guest Disks | ||
% Busy (Agent) | the percentage of guest disk capacity in use | |
Avg Queue Requests (Agent) | the average number of processes that are waiting to access the guest disk | |
Transfers/sec (Agent) | the total number of disk transfer requests processed per second | |
Blocks/sec (Agent) | the total number of data blocks written to and from the disk | |
Avg Service Time (Agent) | the average time, in milliseconds, required to perform a task | |
Avg Wait Time (Agent) | the average time, in milliseconds, that a transaction is waiting in a queue (note that the wait time is directly proportional to the length of the queue) | |
Graphing Disk I/O Rates for
ana Hyper-V Host, ESX Server, or VM
To generate a Disk I/O graph, do the following:
- Go to the Element’s Quick Snapshot page.
For example, in the My Infrastructure the Infrastructure panel, find the ESX server or VM Element whose disk I/O rate you want to graph, click its corresponding gear icon, and then click click Graph Performance. - In the Disk section of the Tree panel, click I/O.
- Select and apply the start and end dates and times for which the graph will chart data, and click Apply Date and Time charts data. For more information about these fields, see Understanding Dates and Times.
- Click one of the Quick Graphs options to display a pre-configured graph in a pop-up window, or skip this step to manually configure a graph.
- In the first step, select whether to graph the highest resource consumers, or specific VMware vSphere components.
If you select Specific, an Element selection dialog will appearappears, requiring you to build a list. - Select the disk I/O metric to include in the graph.
- Click Generate Graph.
A pop-up window will appearappears, displaying the disk I/O graph you have configured.
Graphing Disk I/O Rates for an Agent-Based VM
To generate a Disk I/O graph for a VM that receives metrics via WMI or the up.time Uptime Infrastructure Monitor agent, do the following:
- Go to the Element’s Quick Snapshot page.
For example, in the My Infrastructure the Infrastructure panel, find the ESX server or VM Element whose disk I/O rates you want to graph, click its corresponding gear icon, and then click click Graph Performance. - In the Disk section of the Tree panel, click I/O.
- Select and apply the start and end dates and times for which the graph will chart data, and click Apply Date and Time charts data. For more information about these fields, see Understanding Dates and Times.
- Select whether to graph a disk I/O rate on the VM disk, or a guest disk.
- In the next step, select whether to graph the highest resource consumers, or specific VMs.
If you select Specific, an Element selection dialog will appearappears, requiring you to build a list. - Select the disk I/O metric to include in the graph.
- Click Generate Graph.
A pop-up window will appearappears, displaying the CPU Wait and Ready Time graph you have configured.
Disk Errors
The Disk Errors graph charts the error rates on physical disks on Hyper-V host or ESX servers, or virtual disks on VMs. High error rates indicates performance issues with the underlying hardware.
Disk Error Metrics
The following metrics are displayed in a Disk Errors graph:
Bus Resets/min | the number of SCSI bus reset commands issued on the virtual disk on the VM, or host disk | |
Commands Aborted/min | the number of SCSI commands on the virtual disk on the VM, or host disk, that were aborted | |
Graphing Disk Error Rates for
ana Hyper-V Host, ESX Server, or VM
To generate a disk error rate graph, do the following:
- Go to the Element’s Quick Snapshot page.
For example, in the My Infrastructure the Infrastructure panel, find the ESX server or VM Element whose disk error rates you want to graph, click its corresponding gear icon, and then click click Graph Performance. - In the Disk section of the Tree panel, click Errors.
- Select and apply the start and end dates and times for which the graph will chart data, and click Apply Date and Time . For more informationcharts data. For more information about these fields, see Understanding Dates and Times.
- In the next step, select whether to graph the highest resource consumers, or specific VMware vSphere components. If you select Specific, an Element selection dialog will appearappears, requiring you to build a list.
- Select the disk error metric to include in the graph.
- Click Generate Graph.
A pop-up window will appearappears, displaying the disk error rate graph you have configured.
Disk Latency
The Disk Latency graph indicates the health and performance of physical storage on an a Hyper-V host or ESX server.
Disk Latency Metrics
The following metrics are displayed in a Disk Latency graph:
Hyper-V Host or ESX Server Metrics | ||
Device Latency | the average amount of time, in milliseconds, required to complete a SCSI command from the physical device on the | |
host | ||
Device Read Latency | the average amount of time, in milliseconds, required to complete reading from the physical device on the | |
host | ||
Device Write Latency | the average amount of time, in milliseconds, required to complete writing to the physical device on the | |
host | ||
Kernal Latency | the average amount of time, in milliseconds, VMKernel spent processing each SCSI command on the | |
host | ||
Kernal Read Latency | the average amount of time, in milliseconds, VMKernel spent processing each SCSI read command on the | |
host | ||
Kernal Write Latency | the average amount of time, in milliseconds, VMKernel spent processing each SCSI write command on the | |
host | ||
Queue Latency | the average amount of time, in milliseconds, spent in the VMKernel queue, per SCSI command | |
Queue Read Latency | the average amount of time, in milliseconds, taken per SCSI read command | |
Queue Write Latency | the average amount of time, in milliseconds, taken per SCSI write command | |
Command Latency | the average amount of time, in milliseconds, to process a SCSI command issued by the guest OS to the VM | |
Command Read Latency | the average amount of time, in milliseconds, to process a read command issued from the guest OS to the VM | |
Command Write Latency | the average amount of time, in milliseconds, to process a write command issued | |
from the guest OS to the VM |
Graphing Disk Latency for
ana Hyper-V Host or ESX Server
To generate a percent-wait or percent-ready graph, do the following:
- Go to the Element’s Quick Snapshot page.
For example, in the My Infrastructure the Infrastructure panel, find the ESX server Element whose disk latency you want to graph, click its corresponding gear icon, and then click click Graph Performance. - In the Disk section of the Tree panel, click Latency.
- Select and apply the start and end dates and times for which the graph will chart data, and click Apply Date and Time charts data. For more information about these fields, see Understanding Dates and Times.
- Click the Quick Graph option to display a pre-configured graph in a pop-up window, or skip this step to manually configure a graph.
- In the next step, select whether to graph the highest resource consumers, or specific VMware vSphere components.
If you select Specific, an Element selection dialog will appearappears, requiring you to build a list. - Select the latency metric to include in the graph.
- Click Generate Graph.
A pop-up window will appearappears, displaying the disk latency graph you have configured.
Disk Storage Capacity
A Disk Storage Capacity graph charts the amount of total and used space, in gigabytes, on an Element’s disk. This includes VMware vCenter servers, Hyper-V host servers, ESX servers, and VMs. For VMs that are receiving metrics from the up.time Uptime Infrastructure Monitor agent, the capacity of the file systems are also available.
The current capacity and usage for each datastore is displayed, as well as the week-over-week change, and estimated time to fill. You can select a datastore to graph to see datastore usage trends over time.
Disk Storage Capacity Details
The following metrics are displayed in a Disk Storage Capacity graph:
Total Capacity | the total amount of space available on the system or VM | |
Used | the amount of space | |
currently used | ||
Free | the amount of free space | |
Change Per Week | a positive or negative value indicating the amount of free space compared to one week ago | |
Time to Fill | based on the changes during the last week, the estimated amount of time before the disk is filled | |
Graphing Storage Capacities for
vSphereVirtual Components
To generate a Disk Storage graph for a VMware vCenter Server, an Hyper-V host, ESX server, or a VM, do the following:
- Go to the Element’s Quick Snapshot page.
For example, in the My Infrastructure the Infrastructure panel, find the Element whose storage capacity you want to graph, click its corresponding gear icon, and then click click Graph Performance. - In the Disk section of the Tree panel (for an a Hyper-V host, ESX server, or VM Element), or in the Datastores section (for a VMware vCenter Element), click Storage Capacity.
- Select and apply the start and end dates and times for which the graph will chart charts data. For more information about these fields, see Understanding Dates and Times.
- Select the datastores to include in the graph.
If the Element being graphed is a WMI- or agent-based VM, you can also select the guest file system to include in the graph. - Click Generate Graph.
A pop-up window will appearappears, displaying the storage capacity graph you have configured.
Disk Storage Profile
The Disk Storage Profile gives a breakdown of all datastores for an a Hyper-V host, ESX server, or VM. The current capacity and usage for each datastore is displayed. You can select a datastore to graph to see datastore usage trends over time.
Disk Storage Profile Details
The following information is displayed in a Storage Profile graph:
- Total Capacity
- vDisk Usage
- Snapshot Usage
- Swap Usage
- Other Usage
Graphing a Storage Profile for
ana Hyper-V Host, ESX Server, or VM
To generate a storage profile for an a Hyper-V host, ESX server, or VM, do the following:
- Go to the Element’s Quick Snapshot page.
For example, in the My Infrastructure the Infrastructure panel, find the ESX server or VM Element whose storage profile you want to displaygraph, click its corresponding gear icon, and then click click Graph Performance. - In the Disk section of the Tree panel, click Storage Profile.
- Select and apply the start and end dates and times for which the graph will chart charts data. For more information about these fields, see Understanding Dates and Times.
- Select the datastore you want to include in the graph.
- Click Generate Graph.
A pop-up window will appearappears, displaying the process counts graph you have configured.
Virtual Machine Management Graphs
up.time Uptime Infrastructure Monitor uses the following graphs to track and manage VMs:
Instance Motion
The VMware VMotion Instance Motion tool enables you to move ESX instances from one server to another without any downtime or loss of data. For example, you might use VMotion to move an instance to newer and faster hardware, or to temporarily relocate the instance while performing a hardware upgrade.
The Instance Motion graph enables you to keep track of a moving VMware virtual instance. For a given ESX instance, the graph charts which systems it has been is running on over a given time range.
This graph can be generated when you are viewing a VMware vCenter server, Hyper-V host server, ESX server, or a VM; the topological level at which you begin to configure the graph determines which instances are available to graph.
Generating an Instance Motion Graph
To generate an Instance Motion graph, do the following:
- Go to the Element’s Quick Snapshot page.
For example, in the My Infrastructure the Infrastructure panel, find the VMware vCenter server or ESX server whose VMs’ Element whose VM instance motion you want to graph, click its corresponding gear icon, and then click click Graph Performance. - In the Metrics section of the Tree panel, click Instance Motion.
- Select and apply the start and end dates and times for which the graph will chart charts data. For more information about these fields, see Understanding Dates and Times.
- From the drop-down menu, select a VM.
- Click Generate Graph.
Power Consumption
To assist virtualization initiatives that are meant to save power costs, or to gauge the efficiency of existing virtual datacenters, power usage by watts is available as a graphing metric.
The Power Consumption graph can tell you how much power your ESX hosts are consuming by datacenter, cluster, or individual server. Additionally, you can graph the power usage of individual VMs.
You can graph power usage levels at the VMware vCenter level in order to assess current load distribution, or verify VMware’s automated distributive resource balancing is functioning.
Graphing Power Consumption for a VMware vCenter Server
To generate a power consumption graph for a VMware vCenter server, do the following:
- Go to the Element’s Quick Snapshot page.
For example, in the My Infrastructure the Infrastructure panel, find the VMware vCenter server Element whose power consumption you want to graph, click its corresponding gear icon, and then click click Graph Performance. - In the Metrics section of the Tree panel, click Power Consumption.
- Select and apply the start and end dates and times for which the graph will chart data, and click Apply Date and Time . For more informationcharts data. For more information about these fields, see Understanding Dates and Times.
- Select the logical group whose power consumption you want to graph.
- In the next step, select Select whether to graph the highest resource consumers, or specific VMware vSphere components.
If you select Specific, an Element selection dialog will appearappears, requiring you to build a list. - Click Generate Graph.
A pop-up window will appearappears, displaying the power consumption graph you have configured.
Graphing Power Consumption for
ana Hyper-V Host or ESX Server
To generate a power consumption graph for an ESX server, do the following:
- Go to the Element’s Quick Snapshot page.
For example, in the My Infrastructure the Infrastructure panel, find the ESX server or cluster Element whose power consumption you want to graph, click its corresponding gear icon, and then click click Graph Performance. - In the Metrics section of the Tree panel, click Power Consumption.
- Select and apply the start and end dates and times for which the graph will chart charts data. For more information about these fields, see Understanding Dates and Times.
- Click Generate Graph.
A pop-up window will appearappears, displaying the power consumption of the ESX server over the specified time period.
Power States
Power States graphs allow you to graph VM activity on an ESX a host server, or ESX activity on a VMware vCenter server.
The power state graphs help you manage both available computing resources within your VMware vSphere clusters and datacenters, as well as power consumption in your physical datacenters.
Virtual Element Power States
The following states are displayed in a Power States graph:
vCenter Server Metrics | ||
VMs Powered On | the virtual machine is powered on | |
ESX Powered On | the host is powered on | |
ESX Powered Off | the host was powered off by an administrator through the VMware vSphere Client | |
ESX Unknown | as is the case in the VMware vSphere Client, a host that is in an unknown state is assumed to | |
be powered off by an administrator | ||
ESX In Maintenance | the host was put in maintenance mode by an administrator | |
ESX In Standby | the host was put in standby mode either explicitly by an administrator, or automatically by vSphere Distributed Power Management (DPM) | |
Hyper-V Host and ESX Server Metrics | ||
VMs Powered On | the virtual machine is powered on | |
VMs Powered Off | the virtual machine is powered off | |
VMs Suspended | the virtual machine is not running, but a snapshot of its running applications and processes is retained. | |
Graphing Power States for a vCenter Server
To generate a Power States graph, do the following:
- Go to the Element’s Quick Snapshot page.
For example, in the My Infrastructure the Infrastructure panel, find the VMware vCenter server whose ESX server or VM Element whose power states you want to graph, click its corresponding gear icon, and then click click Graph Performance. - In the Metrics section of the Tree panel, click Power States.
- Select and apply the start and end dates and times for which the graph will chart data, and click Apply Date and Time charts data. For more information about these fields, see Understanding Dates and Times.
- Click one of the Quick Graphs options to display a pre-configured graph in a pop-up window, or skip this step to manually configure a graph.
- In the first step, select whether to graph power states by datacenter or cluster.
- In the next step, select whether to graph the highest resource consumers, or specific VMware vSphere components.
If you select Specific, an Element selection dialog will appearappears, requiring you to build a list. - Select the power states you want to include in the graph.
- Click Generate Graph.
A pop-up window will appearappears, displaying the CPU Wait and Ready Time graph you have configured.
Graphing VM Power States for
ana Hyper-V Host or ESX Server
To generate a power status graph for an ESX server’s a Hyper-V host or ESX server VMs, do the following:
- Go to the Element’s Quick Snapshot page.
For example, in the My Infrastructure the Infrastructure panel, find the ESX server Element whose power states you want to graph, click its corresponding gear icon, and then click click Graph Performance. - In the Metrics section of the Tree panel, click Power States.
- Select and apply the start and end dates and times for which the graph will chart charts data. For more information about these fields, see Understanding Dates and Times.
- Select the power states you want to include in the graph.
- Click Generate Graph.
A pop-up window will appearappears, displaying the power states graph you have configured.