...
- A NetFlow dashboard is added to your Dashboards tab once the Scrutinizer integration configuration is added. When the NetFlow dashboard is selected, it displays the Scrutinizer dashboard within Uptime Infrastructure Monitor.
If the NetFlow dashboard is not showing, than the integration configuration done in the above steps did not work or was not saved.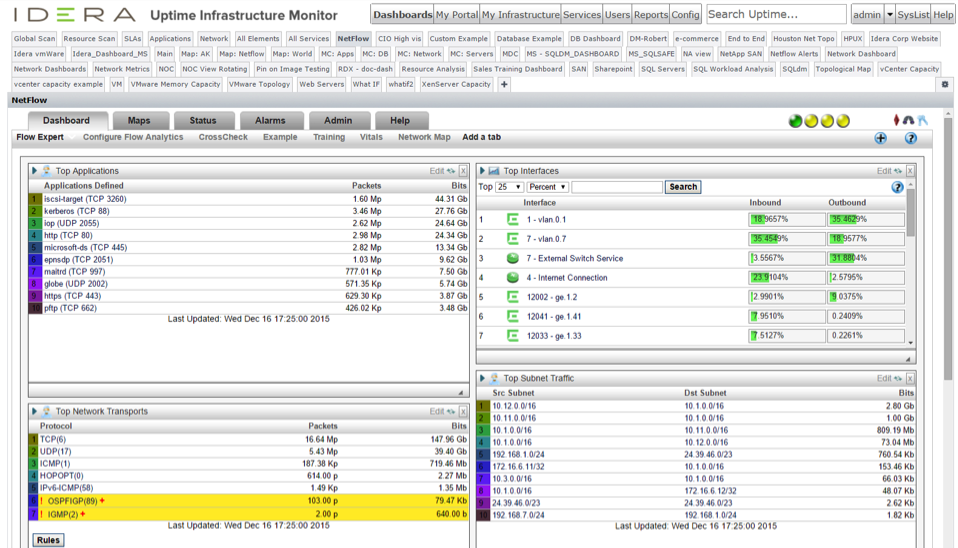
- If a network device is being monitored in both Uptime Infrastructure Monitor and Scrutinizer, when you selected the network devices in the My Infrastructure list and go to Graphing, a NetFlow options will show up in the left menu in the Network section. Selecting this Netflow option will generate a Scrutinizer graph that covers a specified time frame. It shows the monitored node’s bi-directional throughput rates through known ports, which are determined based on use by all known applications.
...