...
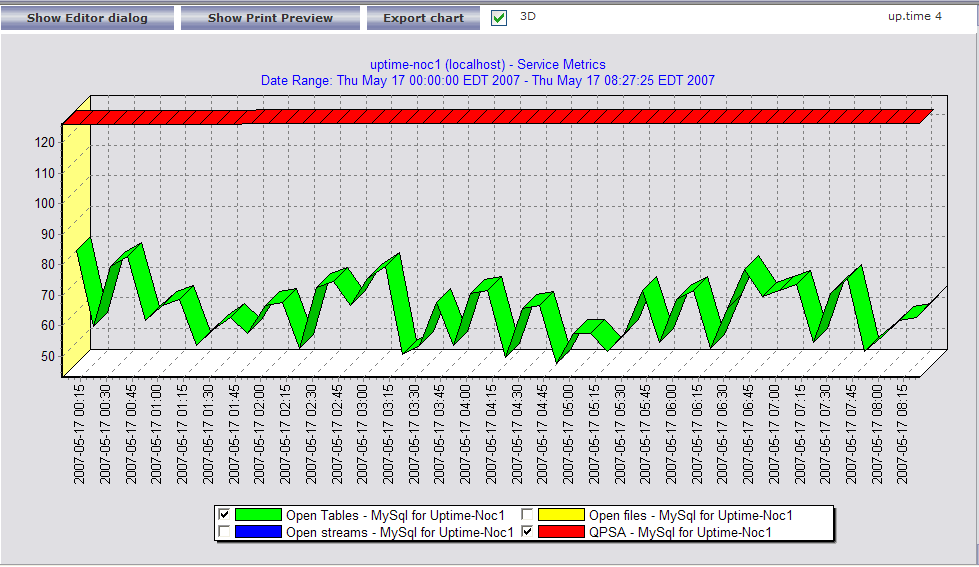
MySQL (Advanced Metrics) Monitor. The MySQL (Advanced Metrics) service monitor provides detailed internal performance information from your database server. In an instanced environment you will need to add a single monitor to each instance (the monitor will track performance of all databases within any given instance). If you want to graph or report on internal database performance at a later date, be sure to click the Save for Graphing checkbox beside each statistic in the service monitor. For a full list of metrics available from the MySQL (Advanced Metrics) service monitor, please see the MySQL Advanced Metrics article. The following graph shows an example of MySQL performance statistics colected from an existing MySQL Advanced service monitor:
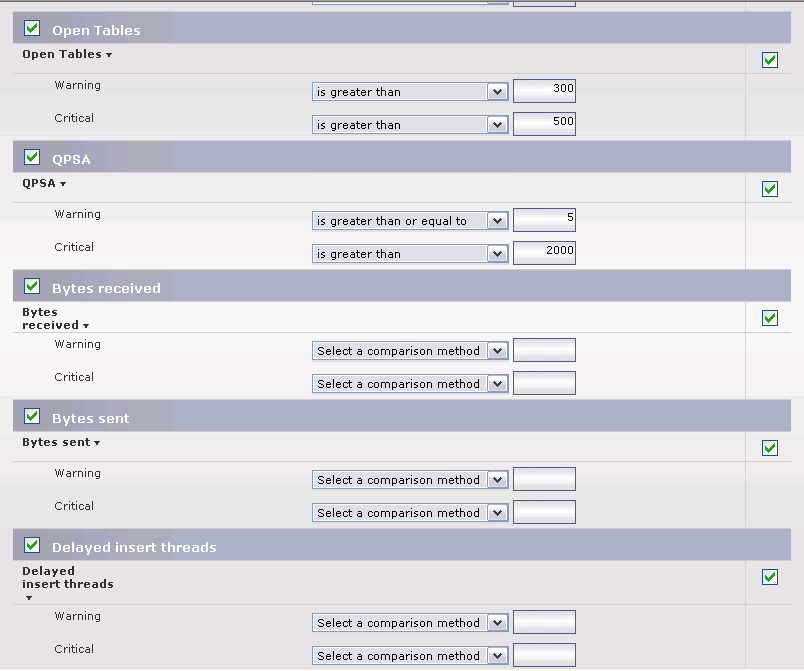
The following example shows some important settings and thresholds in the MySQL (Advanced Metrics) Monitor:
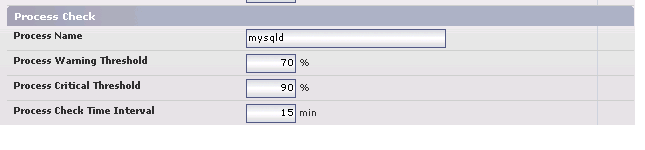
Note title Note Many thresholds within the MySQL (Advanced Metrics) service monitor will depend on the size and usage of your database server and each instance that is running on it. We suggest enabling the Save for Graphing option on each statistic and then letting the monitor collect data for 2 to 3 days. After that time, review the collected data to see how each statistic has trended over time, and pick thresholds that seem appropriate to your installation. Performance Service Monitor. The Performance Service monitor will allow you to monitor the average CPU consumption of your critical database processes over time. We suggest that each database process have a Performance monitor dedicated to it. Each process should not consume more than an average of 70% of system CPU for a period greater than 15 minutes. Here are some example settings for the Performance Service monitor:
...