...
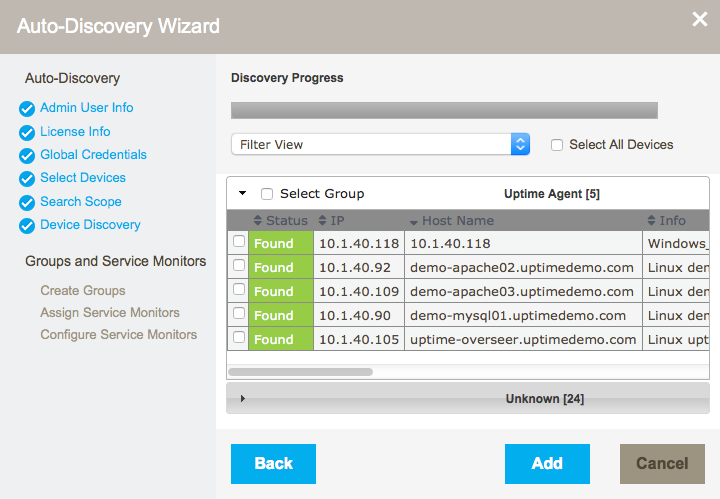
Once a list of systems in the range of IP addresses that you specified is generated, you can selectively add them to Uptime Infrastructure Monitor.
Using the Auto-Discovery Wizard
The Auto-Discovery wizard runs automatically the first time you launch Uptime Infrastructure Monitor or can be launched at any time by clicking the Config tab, and then clicking Auto Discovery from the left menu.
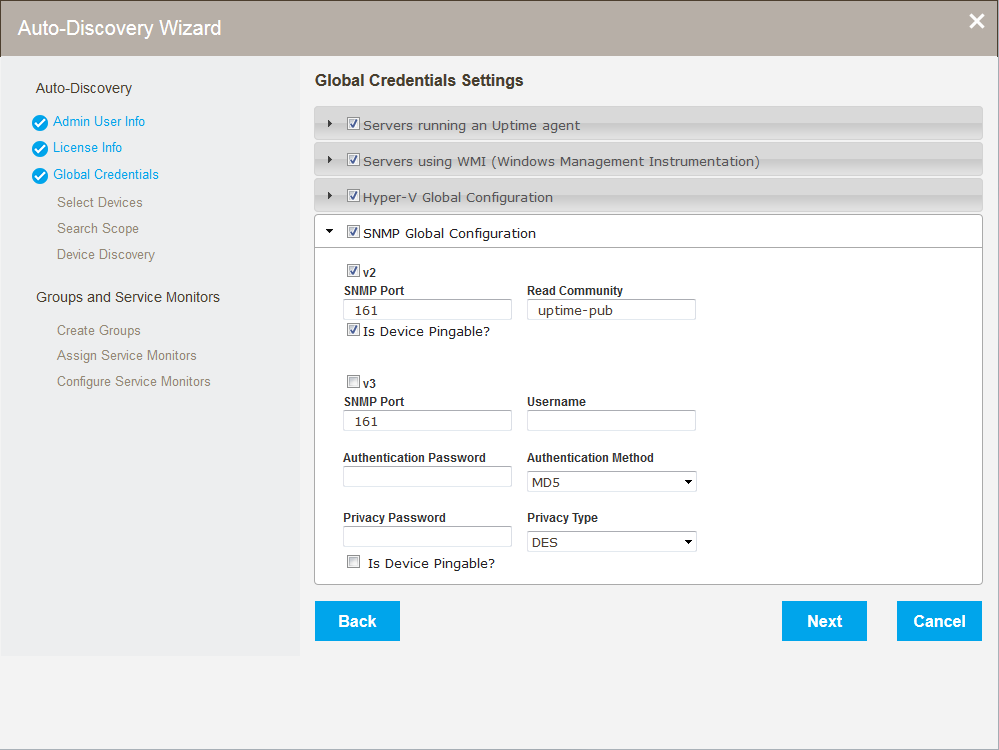
Set global credentials
The Global Credentials Settings page of the Auto-Discovery wizard Wizard allows users to :
...
set global configurations and credentials including :
- Servers running an Uptime Agent
- Servers running using WMI (Windows Management Instrumentation)
- SNMP Global Configuration (v2 and v3)
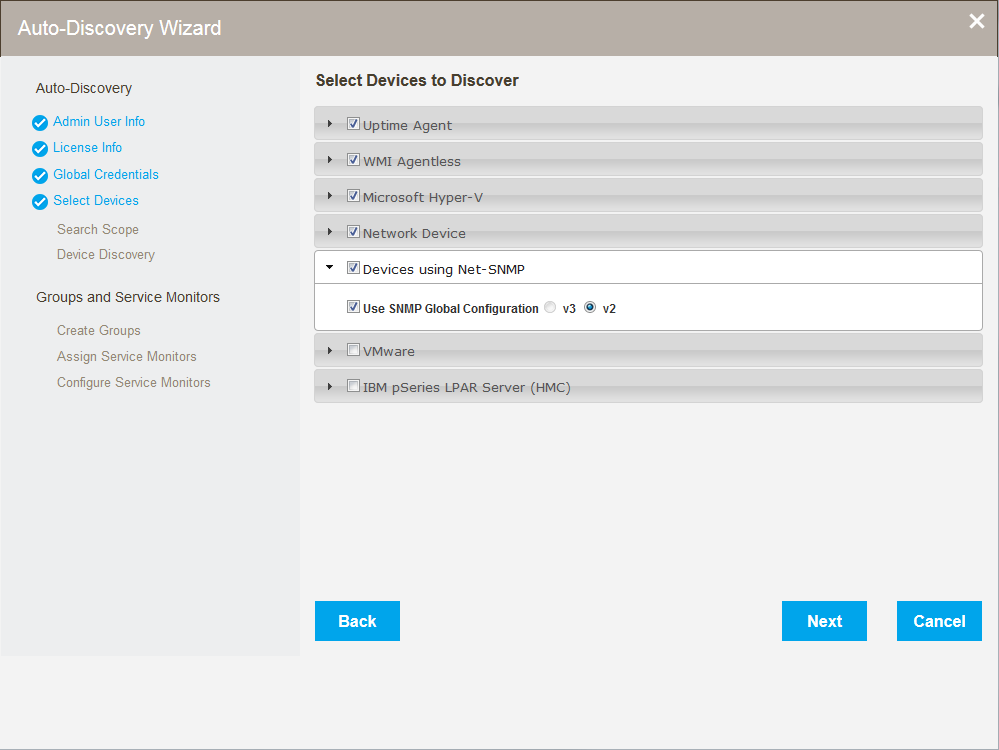
Select device types for discovery
...
Discover and Add Devices
The Auto-Discovery Wizard Select Devices to Discover page lets users set options to filter the types of devices discovered when the wizard runs. All of the following device types can be discovered and added in a single pass of the
...
Auto-Discovery Wizard:
- Uptime Agentagents
- WMI Agentlessagentless
- Network Devicesdevices
- Devices using Net-SNMP
- VMware
- IBM pSeries LPAR Servers servers (HMC)
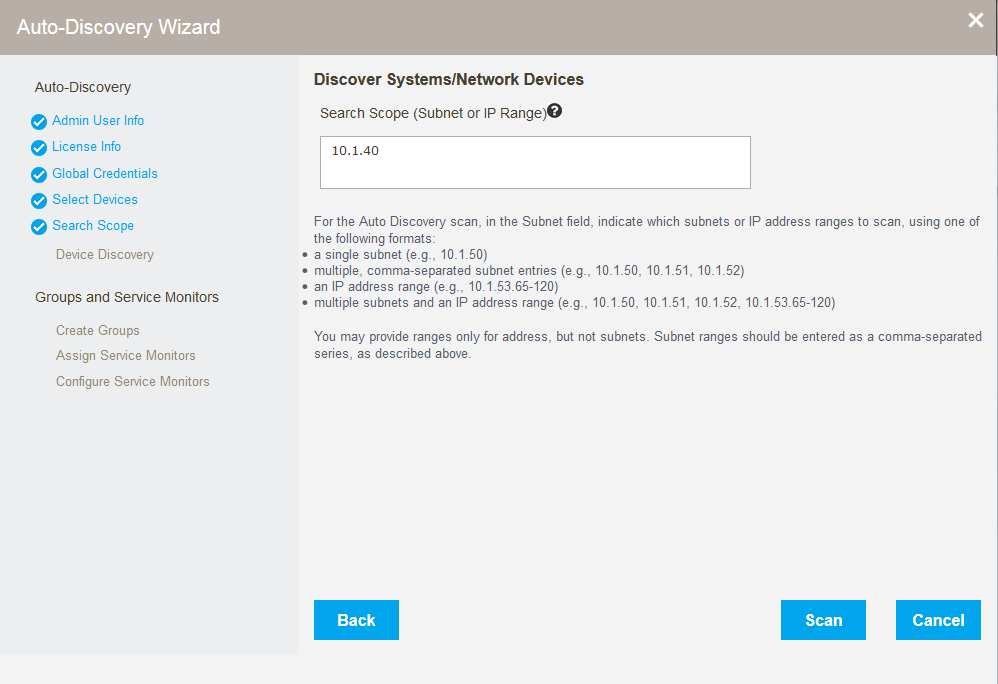
Set the search scope
Restrict the range the Auto-Discovery Wizard searches using the Discover Systems/Network Devices page. Simply enter a subnet or IP range to filter where to look for new devices.
Using discovered devices
Once discovered, select devices to:
- create groups
- add Service Monitors
- configure Service Monitors
Create groups
Depending on the type of devices added, Uptime Infrastructure Monitor automatically creates the following device groups:
- Windows Servers
- Linux Servers
- VMware
- IBM Servers
The Auto-Discovery Wizard also automatically creates the following groups, which can be viewed in the Infrastructure tab:
- Applications
- SLA
Add Service Monitors
Easily add service monitors to devices found and added in discovery. Default values allow users to simply review, and then click Next on the parameter steps to add the monitors. In addition to the monitors created by default, users can easily add:
- Windows Server Performance (created if
- Windows servers are
- added )
- Performance Check
- File System Capacity
- :
- Windows Server Performance
- Performance Check
- File System Capacity
- MS-SQL Checks
(created if Windows servers are added) - Windows Server Performance
- Windows Service Check (MSSQLSERVER)
- SQL Basic Check (runs a query to test query engine)
- SQL Advanced Checks (pulls performance information from the DB engine)
- Active Directory
- Directory Services Test
- DNS
- Linux servers added:
- Linux Server Performance
- Performance Check
- File System Capacity
- Any servers added:
- MySQL Checks
(created if any Servers are added) - MySQL Basic Checks (runs a query to test query engine)
- MySQL Advanced Checks (pulls performance information from the DB engine)
- Active Directory *created if Windows servers are added
- Directory Services Test (We call it Active Directory)
- DNS
Depending on the devices added, Uptime Infrastructure Monitor automatically creates the following device groups:
- Windows Servers
- Linux Servers
- VMware
- IBM Servers
The Auto-Discovery wizard also automatically creates the following groups, which can be viewed in the Infrastructure tab:
- Applications
- SLA