Overview
In up.timeUptime Infrastructure Monitor, a service level agreement (SLA) measures your IT infrastructure’s ability to meet performance goals, particularly from the end-user perspective. Different goals can focus on different aspects of your infrastructure from underlying network performance, to back-end database availability, to user-facing application server response time. Given this broad coverage, a performance goal encompasses anything from a handful of monitored systems to an entire production center.
Defining and working toward fulfilling SLAs provides you with more insight into the performance and planning of your infrastructure:
- Measure the performance of your infrastructure from the end-user perspective.
An SLA can measure the success of your IT infrastructure by using end-user-focused service monitors such as the Web Application Transaction monitor and the Email Delivery monitor.
- Translate IT infrastructure demands into quantifiable and reportable goals.
Use SLAs to methodically set expectations on all or the most critical aspects of your infrastructure. SLAs provide you with metrics with which you can gauge the success of your network administration.
- Use trends to anticipate new infrastructure requirements.
Trend lines in SLA reports can give you an estimate for when your current hardware deployment requires augmentation.
- Generate SLA reports that demonstrate compliance and break down objectives.
Compliance reports quantify the value of the IT department’s efforts, and objective-based reports exist to identify recurring problems that affect business outcomes.
SLAs, Service Monitors, and SLOs
Like other up.time Uptime Infrastructure Monitor Elements (i.e., systems, network devices, and Applications) an SLA definition consists of service monitors that you have previously created. Depending on its use, an SLA can consist of a single service level objective (SLO) that in turn consists of a single service monitor.
In other cases, an SLA’s coverage can be broad enough to include an ungainly list of service monitors; in this case the SLA can be refined to consist of multiple SLOs that focus on different aspects of the SLA. Creating multiple objectives helps you further refine your performance targeting and reporting.
For example, consider an SLA called “Web Application” that focuses on IT performance for end users. The SLA’s objectives could be broken down by performance:
- SLO 1, application availability: the application is available 99% of the time (e.g., using an HTTP monitor)
- SLO 2, application speed: the application’s Web transactions always complete in fewer than 10 seconds (e.g., using the Web Application Transaction monitor)
Consider another example: an SLA called “Customer Service Group” that focuses on the operational readiness of a support team. The SLA’s objectives could be broken down by application:
- SLO 1: helpdesk application
- SLO 2: bug-tracking application
- SLO 3: email service
...
SLA-Creation Strategies
The key to an effective SLA is defining a service level that satisfies end users, yet is also attainable by IT staff and their systems configurations. This section covers the suggested steps to pinpointing this target service level:
- ensure service monitors exist for all SLA-related Elements (if you are a new up.time Uptime Infrastructure Monitor user, all of these must be created)
- define an SLA and its objectives
- use the SLA Detailed report to identify and resolve outages or underperforming Elements
- use the SLA Summary report to develop a baseline
Setting Up and Gathering Data for Monitors
Determine which service monitors best reflect the end-user experience, based on the aspect of your infrastructure that your SLA covers. (See SLAs, Service Monitors, and SLOs for some sample SLAs and objectives.)
up.time Uptime Infrastructure Monitor users who do not have existing service monitors should create them and allow them to accumulate data for at least one week. Having historical data is essential to determining what level of service you should target.
Identifying Outages and Improvable Performance
When added to an SLA, service monitors that are collecting data immediately contribute to the SLA’s reported status. For example, if all of an SLA’s service monitors have a year’s worth of historical data, creating a trial SLA allows you to see how it would have performed over that last year. Having this historical data in SLA reports helps you analyze each component service monitor in the context of the SLA.
Consider a sample SLA called "System Performance" that is meant to ensure your application servers are not experiencing excessive loads; this can be indicated by CPU usage and disk space. The first service level objective is based on the Performance Check monitor for the application servers. A critical state occurs when CPU usage exceeds 90%. The second service level objective is based on the File System Capacity monitor. A critical state occurs when remaining disk space falls under 10%.
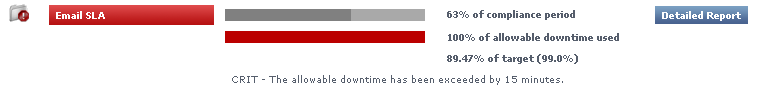
After creating an SLA based on these objectives, the SLA is immediately shown to be in a critical state—for the current Monitoring Period, one or both of the objectives have already failed to meet the defined service level:
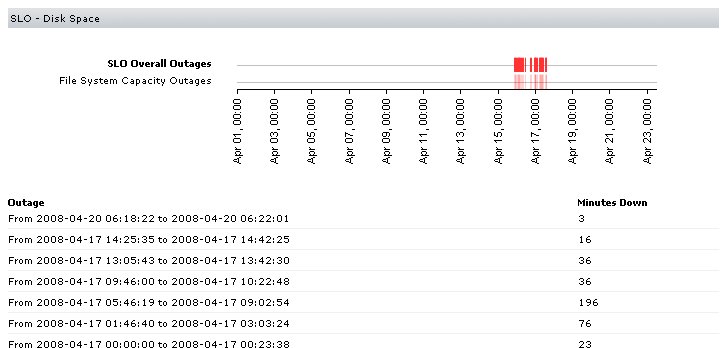
You can investigate outages using the SLA Detailed report. In this example, you determine that the cause the SLA failure was a prolonged
disk-space-related outage that, based on the outage graph, appears to be resolved:
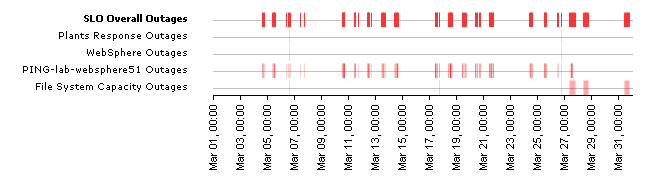
However, there may be cases were analyzing the SLA Detailed report shows intermittent outages that have not caused your trial SLA to fail, but represent under-performing services that should be optimized:
Developing Baselines
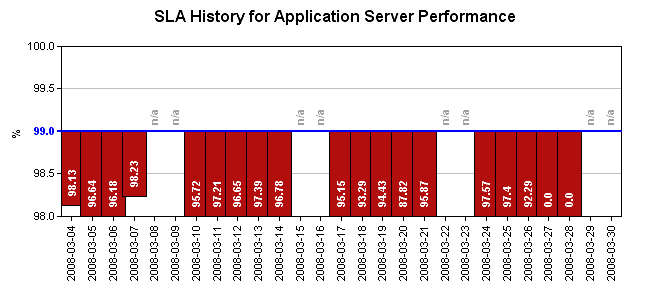
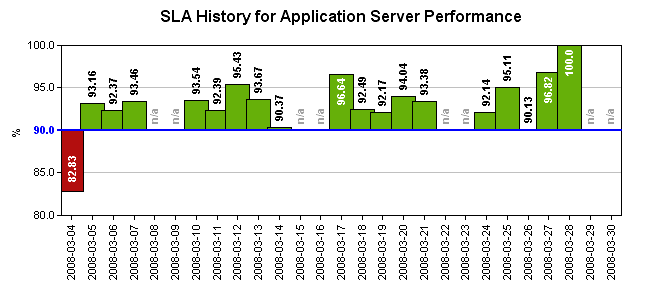
After outages and under-performing systems are addressed, use the SLA Summary report to compare test service levels to historical data.
Find a service level that is attainable. For example, in the SLA graph below, a 95% service level would be more realistic than the default 99% level, given the historical data. In the bottom SLA graph, although the 90% service level is compliant based on historical data, the performance history shows that a 95% service level is attainable if the IT department is able to isolate and improve key under-performing systems.
Working with SLA Reports
up.time Uptime Infrastructure Monitor provides two types of SLA reports. The SLA Summary report provides high-level SLA compliance information, and the SLA Detailed report provides SLO- and service-level compliance information for system administrators.
See Reports for Service Level Agreements for more information.
Adding and Editing SLA Definitions
Adding and using an SLA requires that you first define the SLA, then add one or more SLOs to it.
| Info |
|---|
| When you create an SLA, it is inserted into the current compliance period. For example, a newly created SLA that reports over a monthly compliance period is, if created on the 15th of the month, already around 50% through the period. |
Adding a Service Level Agreement
To add a service level agreement to
up.timeUptime Infrastructure Monitor, do the following:
- In the My Infrastructure panel, click Add Service Level Agreement.
The Add Service Level Agreement window appears.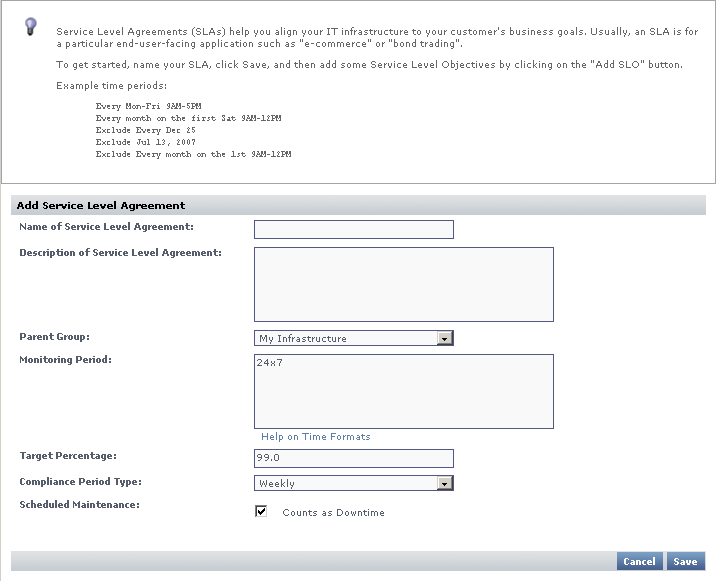
- Enter a descriptive name for the SLA in the Name of Service Level Agreement field.
This name appears on both My Infrastructure and Dashboards. - Optionally enter a description for the SLA in Description of Service Level Agreement field.
Although this step is optional, this description appears in generated SLA reports; therefore, it is recommended that you provide a detailed description of the SLA including what it is meant to accomplish and of which SLOs it consists. - Optionally select the group of systems in your up.time Uptime Infrastructure Monitor environment with which this system is associated from the Parent Group dropdown list.
By default, the SLA is added to the My Infrastructure group.
For more information on groups, see Working with Groups. - If it is not continuous (i.e.,
24x7), enter a Monitoring Period during which the SLA’s compliance is measured.
You must create a time period definition (e.g.,Every Mon-Sat 8AM-6PM). See Monitoring Periods and Time Period Definitions for more information. - If it is not the default 99.0%, enter a Target Percentage against which the SLA’s compliance is measured.
- Ensure you have selected the correct Compliance Period Type from the dropdown list.
- Indicate whether scheduled system maintenance counts as downtime.
- Click Save.
Once saved, the SLA’s Service Level Agreement General Information subpanel is displayed (see Viewing SLA Details for more information). From this page, you can add SLOs, as well as associate Alert Profiles and Action Profiles to the SLA.
Adding Service Level Objectives to an SLA
To add a service level objective to an SLA, do the following:
- In the My Infrastructure panel, click the name of the Service Level Agreement that you want to edit.
The Service Level Agreement General Information subpanel appears. - Click Add SLO.
The Add Service Level Objective window appears.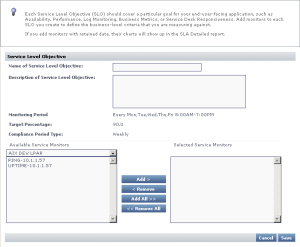
- Enter a descriptive name for the SLO in the Name of Service Level Objective field.
This name appears anywhere in My Infrastructure and Dashboards. - Enter a description for the SLO in Description of Service Level Objective field.
Although this step is optional, this description appears in SLA Detailed reports; therefore, it is recommended that you provide a detailed description of the SLO including what goal is accomplished, and of which service monitors it consists. - Add a service monitor to be associated with the SLO by first selecting its host from the dropdown list, then adding the service monitor.
- Continue to add service monitors to the SLO as required.
- Click Save.
Associating Alert and Action Profiles to an SLA
To add a service level objective to an SLA, do the following:
- In the My Infrastructure panel, click the name of the Service Level Agreement that you want to edit.
The Service Level Agreement General Information subpanel appears. - Associate Alert Profiles with the SLA by clicking Edit Alert Profiles.
- In the Alert Profile Selector pop-up window, select one or more of the Available Alert Profiles from the list, then click Save.
- If required, associate Action Profiles with the SLA by clicking Edit Action Profiles.
- In the Action Profile Selector pop-up window, select one or more of the Available Action Profiles from the list, then click Save.
Editing SLA and SLO Definitions
To edit a service level agreement, do the following:
- In the My Infrastructure panel, click the gear icon beside the Service Level Agreement that you want to modify, then click Edit.
The Edit Service Level Agreement window appears. - Edit the SLA as described in the previous section.
See Adding a Service Level Agreement for information. - Because SLA reporting and monitoring is based on weekly or monthly compliance periods, changing any of the following on an existing SLA affects the reported SLA status and generated reports:
- Monitoring Period
- target percentage
- compliance period type
Info Any changes made are immediately reflected in any SLA reporting.
To edit a service level objective, do the following:
- In the My Infrastructure panel, click the name of the Service Level Agreement that you want to modify, then click Edit.
The Service Level Agreement General Information subpanel appears. - Click the SLO’s corresponding Edit icon.
Edit the SLO as described in the previous sections.
See Adding Service Level Objectives to an SLA for information.
Because SLA reporting and monitoring is based on weekly or monthly compliance periods, changing the service monitors that make up an SLO definition affects the reported SLA status and generated reports.Info Any changes made are immediately reflected in any SLA reporting.