...
Oracle (Advanced Metrics)
The Oracle (Advanced Metrics) monitor captures a number of performance tuning metrics for your Oracle database. Some Oracle metrics are for tuning devices for long-term performance gains, rather than avoiding outages. This applies to following probes: Buffer Cache, Data Dictionary Cache, Disk Sort Ratio, Library Cache, and Redo Log. You should schedule the monitor to gather data less frequently - perhaps every hour or every two days.
Configuring Oracle (Advanced Metrics) Monitors
To configure Oracle (Advanced Metrics) monitors, do the following:
- In the Oracle (Advanced Metrics) monitor template, complete the monitor information fields.
To learn how to configure monitor information fields, see Monitor Identification. - Complete the following fields:
- Port
The number of the port on which the Oracle service is listening. - Username
The user name that is required to login log in to the database. - Password
The password that is required to login log in to the database. SID / Global Database Name
The Oracle System Identifier (SID) that identifies this Oracle instance. The SID defaults to database, and typically matches the database name. The SID It is included in the CONNECT DATA paths of the connect descriptors in the the
tnsnames.orafile file, and in the definition of the TNS listener in the thelistener.orafile. file.Depending on your configuration, you may need to provide the full Global Database Name, which includes both the database name and database domain (for example, instead of
orcl, enterorcl.uptimesoftware.com).Noteinfo If you do not complete the Username
and Password fields, Password, and SID / Global Database Name fields, and up.time
will attemptfails to connect to the database
. If connection fails, the database returns a SQL exception error.
- Buffer Cache Hits Ratio
Enter the Warning and Critical thresholds for buffer cache hits that are completed without accessing disk I/O. To gather as much application data as possible, you should enter a high buffer cache hits ratio.
An Oracle database maintains its own buffer cache inside the system global area for each instance. A properly-sized buffer cache can yield a cache hit ratio over 90%. If a buffer cache is too small, the cache hit ratio will be small and the database uses more physical disk I/O. If a buffer cache is too large, then parts of the buffer cache will waste memory resources. - Data Dictionary Cache Hits Ratio
Enter the Warning and Critical thresholds for data dictionary cache hits that are completed without accessing disk I/O.
The data dictionary cache tables provide information about all of the objects stored in your dictionary - for example tablespaces, files, users, rollback segments, constraints, synonyms. A hit ratio approaching 100% is ideal. - Library Cache Hits Ratio
Enter the Warning and Critical thresholds for the rate at which library cache pin misses occur.
A pin miss occurs when an session executes a statement that has already been parsed, but which is no longer in the shared pool. - Redo Log Space Request Ratio
Enter the Warning and Critical thresholds for the number of redo log space requests per minute that have been made since the server was started. - Disk Sort Rate
Enter the Warning and Critical thresholds for the rate of Oracle sorts that are too large to be completed in memory and which are sorted using a temporary segment. - Active Sessions
Enter the Warning and Critical thresholds for the number of active sessions based on the value of V$PARAMETER.PROCESSES in the file init.ora . - Oracle Blocking Sessions
Enter the Warning and Critical thresholds for the number of sessions that are preventing other sessions from committing changes to the Oracle database. - Oracle Idle Sessions
Enter the Warning and Critical thresholds for the number of Oracle sessions that are idle, as determined by the Time Idle value that you specify. Only the sessions that have been idle for the duration (measured by the Time Idle value), in seconds, are considered idle. - Response Time
Enter the Warning and Critical Response Time thresholds for the length of time a service check needs to complete. For more information, see Configuring Warning and Critical Thresholds.
- Port
- Click the Save for Graphing checkbox to save the data for a metric to the DataStore, which can be used to generate a report or graph.
- Complete the following settings:
- Timing Settings (see Adding Monitor Timing Settings Information for more information)
- Alert Settings (see Monitor Alert Settings for more information)
- Monitoring Period settings (see Monitor Timing Settings for more information)
- Alert Profile settings (see Alert Profiles for more information)
- Action Profile settings (see Action Profiles for more information)
- Click Finish.
Oracle (Basic Checks)
The Oracle (Basic Checks) monitor does the following:
- determines whether or not a host running an Oracle database is available
- determines whether or not an Oracle service is running on a system
- determines whether or not you can log into an Oracle database
evaluates a response based on a script that you have executed against a database or database instance
Info Use the Oracle Tablespace Check monitor to check Oracle tablespaces.
Configuring Oracle (Basic Checks) Monitors
To configure Oracle (Basic Checks) monitors, do the following
- In the Oracle (Basic Checks) monitor template, complete the monitor information fields.
To learn about monitor information fields, see Monitor Identification. - Complete the following fields:
Port
The number of the port on which the Oracle service is listening.Info If you enter a value in the SID field, up.time can capture the port value from the SID of the Oracle instance.
- Port Check (Optional)
Select this option to open a socket connection that determines whether or not the database is listening on the defined port. - Username
The user name that is required to login log in to the Oracle database. - Password
The password that is required to login log in to the Oracle database. - SID / Global Database Name
The Oracle System Identifier (SID) that identifies the Oracle instance. The SID defaults to the database name, and defaults to the database name. Depending on your configuration, instead of the SID, you may need to provide the full Global Database Name, which includes both the database name and database domain (for example, instead oforcl, enterorcl.uptimesoftware.com).
If you enter a value in this field, up.time can capture the number of the port on which Oracle is listening. Script File
Click the Script File check box and then enter the The full path on the Monitoring Station to the script that this monitor will run against the database.Info If you configured your database to allow logins with a user name and password, and you specify the script file but no login information, the script will fail and an error message appears on the Global Scan dashboard. The script will run if you have configured your database to allow logins without a user name and password.
- Script
Select this option and then type or copy the script that you want up.time to against the database into this text box. Use this option if you do not have access to the file system on the Monitoring Station, or if your script is short or will not regularly change. Directly input the script that you want up.time to against the database into the text box. - Match
Enter a string that you want to match against the return value from the script. - Response Time
Enter the Warning and Critical Response Time thresholds. For more information, see Configuring Warning and Critical Thresholds.
- Click the Save for Graphing checkbox check box to save the response-time data for a metric to the DataStore, which can be used to generate a report or graph.
- Complete the following settings:
- Timing Settings (see Adding Monitor Timing Settings Information for more information)
- Alert Settings (see Monitor Alert Settings for more information)
- Monitoring Period settings (see Monitor Timing Settings for more information)
- Alert Profile settings (see Alert Profiles for more information)
- Action Profile settings (see Action Profiles for more information)
- Click Finish.
Oracle Tablespace Check
The Oracle Tablespace Check monitors the size (as a percentage) of individual tablespaces within Oracle database instances. The Oracle Tablespace Check alerts you when a tablespace in your instance exceeds the defined thresholds.
Each database is logically divided into one or more tablespaces. One or more data files are explicitly created for each tablespace to physically store the data in a tablespace. The combined size of the data files in a tablespace is the total storage capacity of the tablespace. For example:
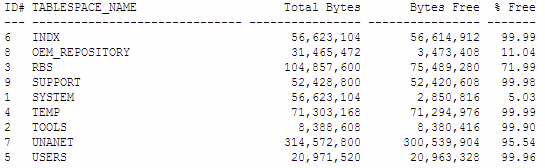
In the above table, the SYSTEM tablespace is over 95% full. If you set the Warning threshold to 90%, and the Critical threshold to 95%, the Oracle Tablespace Check returns a status of Critical.
| Info |
|---|
Use the Oracle (Basic Checks) monitor to determine the availability of Oracle databases, the performance of services, and the matched response of scripts. For more information, see Sybase. |
Configuring Oracle Tablespace Check Monitors
To configure Oracle Tablespace Check monitors, do the following:
- In the Oracle Tablespace Check monitor template, complete the monitor information fields.
To learn how to configure monitor information fields, see Monitor Identification. - Complete the following fields:
- Port
The number of the port on which the Oracle service is listening. The default is 1521 . - Username
The user name that is required to login to the Oracle database. - Password
The password that is required to login to the Oracle database. SID
The Oracle System Identifier (SID) that identifies the Oracle instance. The SID defaults to the database name.
The SID is a unique name for an Oracle instance to switch between Oracle databases. The SID is included in the CONNECT DATA paths of the connect descriptors in the tnsnames.ora file. As well, the SID is in the definition of the TNS listener in the listener.ora file.Info If you do not complete the Username , Password , SID fields up.time will attempt to connect to the database. If connection fails, the database returns a SQL exception error.
- Full Warning Threshold (Mandatory)
Enter a value that will change the status of the Oracle Tablespace Check from OK to Warning.
The warning threshold should be a percentage of the maximum file size, against which the monitor will check data files and log files. - Full Critical Threshold (Mandatory)
Enter a value that will change the status of the Oracle Tablespace Check from OK to Warning.
The critical threshold should be a percentage of the maximum file size, against which the monitor will check data files and log files. - Response Time
Enter the Warning and Critical Response Time thresholds for the length of time that a service check takes to complete. For more information, see Configuring Warning and Critical Thresholds.
- Port
- Click the Save for Graphing checkbox to save the data for a metric to the DataStore, which can be used to generate a report or graph.
- Complete the following settings:
- Timing Settings (see Adding Monitor Timing Settings Information for more information)
- Alert Settings (see Monitor Alert Settings for more information)
- Monitoring Period settings (see Monitor Timing Settings for more information)
- Alert Profile settings (see Alert Profiles for more information)
- Action Profile settings (see Action Profiles for more information)
- Click Finish.
...