...
The following reports enable you to visualize the overall performance of a system in the up.time environment, as well as analyze the information to determine the cause of problems with those systems:
Resource Usage Report
The Resource Usage report tracks the usage of system resources and performance information for systems over a given period of time. In addition to the usage information being reported on, the report displays the following information:
- the name and description of the system
- an overview of the system configuration, including architecture, memory size, operating system version, number of CPUs, and host ID
Creating a Resource Usage Report
To create a Resource Usage report, do the following:
- In the Reports Tree panel, click Resource Usage .
- In the Date and Time Range area, select the dates and times on which to report. For more information, see Understanding Dates and Times
- Select one or more of the following report options:
- Service Status
The status of each service that has been assigned to the selected system or systems. The statuses are OK , WARN , CRIT , MAINT , and UNKNOWN . - Network I/O
The average amount of traffic, measured in megabytes per second, that is travelling through the network interfaces. The report also identifies bursts in network activity that may occur over short intervals. This information appears as a graph in the report. - Free Memory
The amount of free memory available to the system. This information appears as a graph in the report. - File System Capacity
The amount of free disk space on the system. This information appears as a graph in the report. Workload (Top 10 - RSS)
The top 10 processes that are consuming physical memory (in KB), as measured by the run-set size (RSS) of the process. This information appears as a graph in the report.Info This graph does not appear when you generate this report for a VMware ESX system.
- Resource Utilization
The average and maximum amount of CPU and memory use. - Network Errors
Any errors that have occurred with the physical network interface. The errors can be, for example, collisions or handshake errors between a system and a switch. - Page Scanning Statistics
The number of file system pages scanned by the page scanning daemon. This information appears as a graph in the report. Workload (Top - 10 CPU)
The top 10 processes that are consuming CPU time, grouped by user ID, group ID, and process name. This information appears as a graph in the report.Info This graph does not appear when you generate this report for a VMware ESX system.
Multi-CPU
The percentage of total CPU time that is being used on systems with more than one CPU.Info If you find the report’s rendered graph too dense due to a large number of CPUs, alternatively generate a Multi-CPU Usage graph while including fewer CPUs.
- CPU Performance Graph
Tracks the performance of a system’s CPU over a specified time period. This information appears as a graph in the report. - TCP Retransmits
Any network services that may not be completing properly because of undue network or system load. This information appears as a graph in the report. - Disk Statistics
The following statistics for each disk on a system:- percentage of the disk that is busy
- average queue length
- number of reads and writes per second
- number of blocks being accessed per second
- average wait time, in seconds
- average service time, in seconds
Info If the system for which you are creating a report for has multiple disks, a graph for each disk on the system is generated.
- Workload (Top 10 - Memsize)
The top 10 processes that consume system memory, based on the total memory size of the processes - including virtual pages and shared memory. This information appears as a graph in the report.
Info This graph does not appear when you generate this report for a VMware ESX system.
- Service Status
- If you selected more than one report option and plan to report on more than one system, you can optionally click the Group report options by system checkbox.
Selecting this option combines the metrics for each system for which you are generating the report. - To generate reports for systems in specific groups, select the groups from the List of Groups area.
- To generate reports for one or more views, select the groups from the List of Views area.
See Working with Views for more information about views. - If you are generating reports for specific systems, select the systems from the List of Systems .
- Select a report generation option. See Report Generation Options for details.
- If you want to save the report or schedule it to run at a specific time or interval, complete the settings in the Save Reports section of the subpanel.
See Saving Reports and Scheduling Reports for more information.
Resource Hot Spot Report
The Resource Hot Spot report is a key checkpoint report that allows you to quickly identify servers and network devices across your enterprise that may be having performance issues, so you can immediately start working to identify what may be causing them.
The Resource Hot Spot report helps you answer the following types of questions:
- Which servers and network devices in my infrastructure were the top consumers in various resource usage categories?
- Which servers are running short on memory, or are overworked?
- Which VMs' processes need to be shared with another instance?
- Are all network devices correctly configured?
- For resource-strained Elements, is there a configuration issue or is it a resourcing issue?
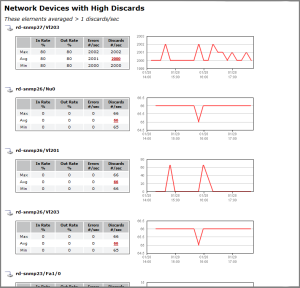
The report is also a valuable investigative tool that helps you quickly focus on the parts of your infrastructure that require troubleshooting. The report can be configured to include full listings of threshold-violating servers and network devices based on key resource-usage metrics such as memory and CPU usage, port throughput caps, or packet-issue counts. The high, low, and average for these metrics are presented, along with historical graphs for offending metrics; these details can help you confirm whether sustained resource strain, or wild swings are being caused by resourcing deficits or configuration errors.
The following are portions of an example Resource Hot Spot report:

| Info |
|---|
The Resource Hot Spot report is a default report that is automatically created and saved for weekly generation on new up.time installations, beginning the third day after up.time was first installed. |
Resource Hot Spot Report Details
The following information comprises the Resource Hot Spot report:
| Servers | |
|---|---|
| Top Servers | Of the servers included in the report, the top five resource consuming servers in terms of CPU, memory, swap usage, and disk usage. These servers are listed regardless of whether they violated resource usage thresholds set during report configuration; if your entire infrastructure is meeting your resource usage criteria for the report, the top-five servers will still be included in the summary for each category. |
| CPU | The percentage of CPU capacity used during the defined time period. In the Top Servers summary, this is an average value for the time period. |
| Mem | The percentage of memory used by processes for the defined time period. In the Top Servers summary, this is an average value for the time period. |
| Swap Usage | The percentage of memory swap space being used during the defined time period. In the Top Servers summary, this is an average value for the time period. |
| Disk Busy | The percentage of time the server disk is handling transactions in progress for the defined time period. In the Top Servers summary, this is an average value for the time period. |
| Servers with High CPU Usage | A listing of all servers included in the report whose average CPU usage for the time period exceeded the threshold defined during report configuration. Each server's entry includes the following information to help correlate the violating metric with other metrics or events:
|
| Servers with High Memory Usage | A listing of all servers included in the report whose average memory usage for the time period exceeded the threshold defined during report configuration. Each server's entry includes the following information to help correlate the violating metric with other metrics or events:
|
| Servers with High Swap Usage | A listing of all servers included in the report whose average memory swap space usage for the time period exceeded the threshold defined during report configuration. Each server's entry includes the following information to help correlate the violating metric with other metrics or events:
|
| Servers with High Disk Busy | A listing of all servers included in the report whose average disk processing for the time period exceeded the threshold defined during report configuration. Each server's entry includes the following information to help correlate the violating metric with other metrics or events:
|
| Network Devices | |
| Top Network Devices | Of the network-device type Elements included in the report, the five most inefficient network devices in terms of in rate, out rate, error count, and discards. These network devices are listed regardless of whether they violated throughput or error thresholds set during report configuration; if all of your network devices are passing the criteria for the report, the top-five network devices will still be included in the summary for each category. |
| In Rate % | The percentage of the network device's maximum throughput, on a per port basis, that was used by inbound packets during the defined time period. |
| Out Rate % | The percentage of the network device's maximum throughput, on a per port basis, that was used by outbound packets during the defined time period. |
| Errors per sec | The average number of errors encountered per second, on a per port basis, during the defined time period. |
| Discards per sec | The average number of packets discarded per second, on a per port basis, during the defined time period. |
| Network Devices with High In Rate | A listing of all network devices included in the report whose average in-rate percentage for the time period exceeded the threshold defined during report configuration. Each network device's entry includes the following information to help correlate the violating metric with other metrics or events:
|
| Network Devices with High Out Rate | A listing of all network devices included in the report whose average out-rate percentage for the time period exceeded the threshold defined during report configuration. Each network device's entry includes the following information to help correlate the violating metric with other metrics or events:
|
| Network Devices with High Errors | A listing of all network devices included in the report whose average error-per-second count for the time period exceeded the threshold defined during report configuration. Each network device's entry includes the following information to help correlate the violating metric with other metrics or events:
|
| Network Devices with High Discards | A listing of all network devices included in the report whose average discarded-packet count for the time period exceeded the threshold defined during report configuration. Each network device's entry includes the following information to help correlate the violating metric with other metrics or events:
|
Creating a Resource Hot Spot Report
To create a Resource Hot Spot report, do the following:
- On the Reports tab, click Resource Hot Spot, which is found in the Performance and Analysis section of the reports tree panel.
- In the date and time range section, select a reporting window.
For more information, see Understanding Dates and Times. - In the Report Options section, configure which components will comprise your report:
- top-five lists for servers or network devices in various resource-usage categories
- comprehensive lists of Elements that are experiencing performance issues in various resource-usage categories
- for the Element list, the threshold used to determine which are experiencing performance issues
- Determine which Elements will be included in the resource hot-spot assessment by selecting Infrastructure Groups, Element Views, or individual Elements from the following sections:
- List of Groups
- List of Views
- List of Elements
- Continue with the desired report generation process:
- generate a report immediately to an email or your screen: see Report Generation Options
- save a generated report immediately: see Saving Reports
- schedule automatic report generation: see Scheduling Reports
Multi-System CPU Report
The Multi-System CPU report charts and compares the CPU performance statistics from multiple systems in your environment. These statistics indicate whether or not the systems are exhibiting balanced behavior, or if processes are being forced off CPUs in certain circumstances.
Creating a Multi-System CPU Report
To create a Multi-System CPU report, do the following:
- In the Reports Tree panel, click Multi-System CPU.
- In the Date and Time Range area, select the dates and times on which to report. For more information, see Understanding Dates and Times
- If you want the report to only include data from certain hours during the day, select those hours from the dropdown lists in the Daily Hours section.
For example, if you want to report to cover the hours from 1:00 a.m. to 1:00 p.m., select 1:00 from the Start dropdown list, and 13:00 from the End dropdown list. - If you want to generate reports for systems in specific groups, select the groups from the List of Groups area.
- To generate reports for one or more views, selecft the groups from the List of Views area.
See Working with Views for more information about views. - If you are generating reports for specific systems in your environment, select them from the List of Systems .
- Select a report generation option. See Report Generation Options for details.
- To save the report or schedule it to run at a specific time or interval, complete the settings in the Save Reports section of the subpanel.
See Saving Reports and Scheduling Reports for more information.
CPU Utilization Summary Report
The CPU Utilization Summary report generates a tabular summary of the CPU and memory consumption over a specific time period. Specifically, this report returns the following information:
- number of CPUs on the server.
- the total processor speed of all the CPUs, in MHz
- the maximum, minimum, and average CPU use, expressed as a percentage
- the maximum, minimum, and average memory use, expressed as a percentage
- the maximum, minimum, and average page scan per second, expressed as a percentage
Creating a CPU Utilization Summary Report
To create a CPU Utilization Summary report, do the following:
- In the Reports Tree panel, click CPU Utilization Summary .
- In the Date and Time Range area, select the dates and times on which to report. For more information, see Understanding Dates and Times
- Select one of the following options from the Sort by dropdown list to sort the results that up.time returns:
- Average CPU (the default)
- Hostname
- # of CPUs
- CPU Speed
- Maximum CPU
- Minimum CPU
- Average Memory
- Maximum Memory
- Minimum Memory
- Average Page Scan
- Maximum Page Scan
- Minimum Page Scan
- Select Ascending or Descending from the Sort Direction dropdown list.
- Optionally, in the Minimum sort value for inclusion field enter a value for the sort threshold.
The report displays items from the Sort By list, whose value is equal to or greater than the value in this field. For example, if you chose # of CPUs from the Sort by list and set this field to 2 , the report only displays systems with two or more CPUs. - Select one or more of the following CPU statistics at which the report will look:
- sys
The percentage of CPU time that is being use to carry out system processes. - usr
The percentage of CPU time that is being used to carry out user processes. - wio
The percentage of CPU time that could be handling processes, but which is waiting for I/O operations to complete.
- sys
- Select one or more of the following statistics on which to report:
- CPU
The percentage of CPU resources that are being used. - Memory
The percentage of system memory that is being used. Page Scans
The number of page scans per second.Info The statistic you select must match the sort criteria that you selected in step 4. For example, if your sort criteria is Average CPU you must also select the CPU statistic. Otherwise, an error message appears when you try to generate the report. Optionally, in the Architectures to exclude field enter either the name of a system architecture or a regular expression that up.time will use to ignore certain system architectures when generating the report.
For example, if you want to exclude all Solaris systems from the report, enter SunOS in the field.Info up.time determines the architecture of a system by checking the output of the uname -a command on UNIX or Linux, or by analyzing one or both of the following Windows registry keys:
HKEY_LOCAL_MACHINE\\Software\\Microsoft\\
WindowsNT\\CurrentVersion
HKEY_LOCAL_MACHINE\\Software\\Microsoft\\
Windows\\CurrentVersion
- If you want to generate reports for systems in specific groups, select the groups from the List of Groups area.
- To generate reports for one or more views, select the groups from the List of Views area.
See Working with Views for more information about views. - If you are generating reports for specific systems in your environment, select them from the List of Systems .
- Select a report generation option. See Report Generation Options for details.
- To save the report or schedule it to run at a specific time or interval, complete the settings in the Save Reports section of the subpanel.
See Saving Reports and Scheduling Reports for more information.
CPU Utilization Ratio Report
The CPU Utilization Ratio report charts, in a table, the ratio of the percentage of CPU usage over a specified period of time. The ratio is derived by dividing the percentage of system time that is being used by the percentage of user time. For example, if the amount of system time that is being used is 22.12% and the amount of user time is 5.2%, then the CPU utilization ratio is 4.25.
This report contains the following information:
- the names of the hosts for which the report has been generated
- the percentage of CPU time that is being used to carry out user processes ( USR % )
- the percentage of CPU time that is being use to carry out system processes ( SYS % )
- the CPU utilization ratio for each host, which is derived by dividing SYS % by USR %=
Creating a CPU Utilization Ratio Report
To generate a CPU Utilization Ratio report, do the following:
- In the Reports Tree panel, click CPU Utilization Ratio .
- In the Date and Time Range area, select the dates and times on which to report.
For more information, see Understanding Dates and Times - If you want the report to only include data from certain hours during the day, select those hours from the dropdown lists in the Daily Hours section.
For example, if you want to report to cover the hours from 1:00 a.m. to 1:00 p.m., select 1:00 from the Start dropdown list, and 13:00 from the End dropdown list. - Optionally, enter a value in the Highlight ratios over threshold field.
Any ratios that exceed the value in this field will be highlighted in the report. For example, if you enter 2 and a server returns a ratio of 3.5%, that ratio is highlighted. - If you want to generate reports for groups of systems, select the groups from the List of Groups area.
- To generate reports for one or more views, select the groups from the List of Views area.
See Working with Views for more information about views. - If you are generating reports for specific systems in your environment, select them from the List of Systems .
- Select a report generation option. See Report Generation Options for details.
- To save the report or schedule it to run at a specific time or interval, complete the settings in the Save Reports section of the subpanel.
See Saving Reports and Scheduling Reports for more information.
Wait I/O Report
The Wait I/O report enables you to determine the amount of time that processes spend waiting on I/O from a system device.
The Wait I/O report contains the following information:
- the names of the hosts for which the report has been generated
- the average, maximum, and minimum wait I/O times expressed as percentages
Creating a Wait I/O Report
To create a Wait I/O report, do the following:
- In the Reports Tree panel, click Wait I/O .
- In the Date and Time Range area, select the dates and times on which to report.
For more information, see Understanding Dates and Times - If you want the report to only include data from certain hours during the day, select those hours from the dropdown lists in the Daily Hours section.
For example, if you want to report to cover the hours from 1:00 a.m. to 1:00 p.m., select 1:00 from the Start dropdown list, and 13:00 from the End dropdown list. - Optionally, enter a value in the Highlight average WIO over threshold field.
Any system with an average Wait I/O percentage that exceeds the value that you enter in this field will be highlighted in red in the report. As well, the following text appears in the header of the report:
Systems with an Average Wait I/O over x.x% are highlighted
Where x.x is the percentage that you entered in this field. - If you want to generate reports for systems in specific groups, select the groups from the List of Groups area.
- To generate reports for one or more views, select the groups from the List of Views area.
See Working with Views for more information about views. - If you are generating reports for specific systems in your environment, select them from the List of Systems .
- Select a report generation option.See Report Generation Options for details.
- Do one of the following:
- Click the Generate Report button.
- Enter a name for the report in the Save to My Portal As field, and optionally enter text in the Report Description field. Then, click Save Report .
The report parameters are saved to the My Portal panel. Doing this does not generate the report.
- To schedule the saved report to run at a specific time or interval, click the Scheduled checkbox.
See Scheduling Reports for more information on configuring a scheduled report.
Inventory Report
The Inventory report provides details about the composition of your monitored infrastructure by operating system, across physical and virtual Elements. The report contents can optionally be organized by group, and can include invidual Element entries.
These different reporting options allow you to confidently assess your inventory from a variety of perspectives, and help you answer the following types of questions:
- How many older versions of the up.time Agent are deployed on my systems?
- What is the operating system breakdown across my infrastructure, both virtualized, and on physical systems?
- I need to upgrade a particular OS version; which systems are candidates for this deployment?
Inventory Report Information
| Info |
|---|
Since the Inventory report displays all monitored Elements, the report is intended for system administrators. Non-administrative up.time users who do not have permission to view all Elements will not be able to see complete inventory listings. |
The following information can be displayed in an Inventory report:
Operating System Summary | ||
unique breakdown of physical and virtual Elements, with totals by OS, and component totals for OS versions | ||
Physical Elements | the total number of systems-type Elements (i.e., not network devices, Applications, and SLAs) this total includes virtual machines that are not managed by a VMware vCenter server Element (e.g., LPARs or VMware VMs manually added to up.time, and not through vSync) | |
Virtual Elements | the total number of Elements running on VM instances (i.e., VM instances with their own UUID) | |
Operating System | the detected operating system, including VMware environments | |
Version | the detected operating system version; build version details are listed if available | |
Element Name | the Element’s host name | |
Architecture | the detected hardware platform type on which the Element’s CPUs are running | |
Agent Version | if applicable, the version of the up.time Agent that is running on the Element | |
Added Date | the date the Element was added to up.time ’s monitored inventory | |
Group | the Element’s My Infrastructure group name | |
Creating an Inventory Report
To create an Inventory report, do the following:
- In the Reports Tree panel, click Inventory Report .
- In the Date and Time Range area, select the dates and times on which to report.
For more information, see Understanding Dates and Times - Optionally select the Don’t List Individual Elements check box to restrict the report to inventory summaries.
- Optionally select the Group by Selected System Groups check box to organize the report by group.
- If you want to generate reports for systems in specific groups, select the groups from the List of Groups area.
- To generate reports for one or more views, select the groups from the List of Views area.
See Working with Views for more information about views. - If you are generating reports for specific Elements in your environment, select them from the List of Elements .
- Select a report generation option.See Report Generation Options for details.
- Do one of the following:
- Click the Generate Report button.
- Enter a name for the report in the Save to My Portal As field, and optionally enter text in the Report Description field. Then, click Save Report .
The report parameters are saved to the My Portal panel. Doing this does not generate the report.
- To schedule the saved report to run at a specific time or interval, click the Scheduled checkbox.
See Scheduling Reports for more information on configuring a scheduled report.
Service Monitor Metrics Report
You can configure the up.time service monitors to retain data, which is saved to the up.time DataStore for later use. The Service Monitor Metrics report visualizes the retained data in a line chart.
For example, if you have configured a service monitor to retain response time data then this report charts any changes in the response time (in milliseconds) that have occurred over the time period that you specified for the report.
Creating a Service Monitor Metrics report is a two-step process:
- enter the basic parameters for the report
- select the values for the retained on which you want to report
Creating Service Monitor Metrics Reports
To create a Service Monitor Metrics report, do the following:
- In the Reports Tree panel, click Service Monitor Metrics .
- In the Date and Time Range area, select the dates and times on which to report.
For more information, see Understanding Dates and Times - If you want to generate reports for systems in specific groups, select the groups from the List of Groups area.
- To generate reports for one or more views, select the groups from the List of Views area.
See Working with Views for more information about views. - If you are generating reports for specific systems in your environment, select them from the List of Elements .
- Click Go to page 2 .
A table containing the current retained service metrics appears in the Service Metrics subpanel. - Click the checkboxes in the Select column to select the variables on which you want to report
- Optionally, select one of the following:
- Show all non-ranged metrics on one chart
This option combines all of the variables you selected in one chart. Any ranged metrics will appear in their own charts. - Display charts as stacked area
Each chart in the report will have two or more data series stacked on top of each other, rather than the line graph that usually appears in the report.
- Show all non-ranged metrics on one chart
- To save the report, do the following:
- Enter a name for the report in the Save to My Portal As field.
- Optionally, enter text in the Description field.
- Click Save Report .
The report parameters are saved to the My Portal panel. Doing this does not generate the report.
- To schedule the saved report to run at a specific time or interval, click the Scheduled checkbox.
See Saving Reports and Scheduling Reports for more information.
...
Reports for Availability
The following reports enable you to visualize the availability metrics for all your mission-critical Applications and your critical system services:
Server Uptime Report
The Server Uptime report is a key checkpoint report that provides you with a focused and succinct snapshot of your infrastructure's availability. Report components include overall availability based on a defined uptime threshold, availability by defined interval over the reporting period, as well as tallies of the number of Elements that experienced one or more outages, and the total number of outages. To assist with follow-up actions, Elements are listed by outage time and include details that help you determine whether the outage frequency or duration is contributing the most to total downtime. The Server Uptime report helps you answer the following types of questions:
- What is the overall uptime of my entire infrastructure, and am I meeting my availability target?
- What is the overall count of outages and my mean time to repair when there is a failure?
- Which Elements or groups are experiencing the most downtime?
The Server Uptime report is also a key starter report, as it is automatically created and saved for new up.time installations. This daily report provides an hourly breakdown of availability, using a 95% uptime threshold. By default, a PDF version of the report is emailed to the SysAdmin user group.
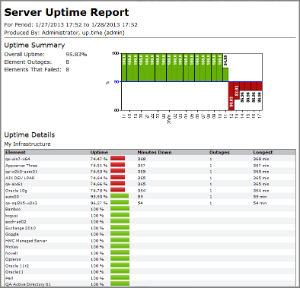
The following is an example of a Server Uptime report:
| Info |
|---|
The Server Uptime report is a default report that is automatically created and saved for daily generation on new up.time installations. |
Server Uptime Report Details
The following details are displayed in the Server Uptime report:
| Uptime Summary | |
|---|---|
| Overall Uptime | The uptime of all Elements included in the report for the defined time period. This is a composite uptime value for all individual Elements that are in an OK, WARN, or MAINT state; Element or Element group averages, or maximum values for a time period do not contribute to overall uptime. |
| Element Outages | The total number of separate Element outages during the time period (since an individual Element can have more than one outage in the same time period). |
| Elements That Failed | The number of Elements that experienced an outage during the time period. Use this value to ensure the previous Element Outages count is not misleading due to the underperformance of, for example, a single Element. |
| availability graph | A breakdown of the overall uptime for the time period, where the granularity is dependent on the Breakdown Type set during report configuration: by hour, day, week, or month. Availability for each time slice (i.e., whether it is marked as pass/green, or fail/red) is determined by the Target Percentage set during report configuration. |
| Uptime Details | |
| Element | The name of the Element that's in this report. Whether this Element is listed individually or within an Element group listing depends on whether you selected the Group by Element Group check box during report configuration. Elements are primarily sorted by uptime; Elements with equal uptime will be sorted by name. |
| Uptime | The uptime for the specific Element during the time period, expressed as a percentage and bar. Element lists in the report are sorted by up.time. The Target Percentage set during report configuration determines whether the Element is marked as pass/green, or fail/red. |
| Minutes Down | The total number of minutes the Element spent in a "down" state (CRIT or UNKNOWN) for the time period. If the Element experienced no downtime, this field will be blank. |
| Outages | The number of outages the Element experienced during the time period. If the Element experienced no downtime, this field will be blank. |
| Longest | The number of minutes that comprises the Element's longest outage during the time period. Use this value to ensure the previous Minutes Down tally is not misleading due to, for example, a particularly long single outage among several short ones. If the Element experienced no downtime, this field will be blank. |
Creating a Server Uptime Report
To create a Server Uptime report, do the following:
- On the Reports tab, click Server Uptime, which is found in the Availability section of the reports tree panel.
- In the date and time range section, select a reporting window.
For more information, see Understanding Dates and Times. - In the Report Options section, configure the look and contents of your report:
- define the Target Percentage that determines whether Elements are displayed as critical performers in the report
- the time slice used to assess the target uptime value defined in the previous step
- Hourly
- Daily
- Weekly
- Monthly
Info Since reports have a finite amount of space to present their information, use a level of granularity that suits the breadth of the date and time range selected for the report (e.g., hourly time slices for a daily report, or daily time slices for a weekly report).
- whether Elements included in the report will automatically be displayed by Element group
- Determine which Elements will be included in the uptime report by selecting Infrastructure Groups, Element Views, or individual Elements from the following sections:
- List of Groups
- List of Views
- List of Elements
- Continue with the desired report generation process:
- generate a report immediately to an email or your screen: see Report Generation Options
- save a generated report immediately: see Saving Reports
- schedule automatic report generation: see Scheduling Reports
Application Availability Report
The Application Availability report tracks the availability of the Applications in your environment, as well as the monitors that are associated with the Applications. This report contains the following information:
- the name of the Application
- the service monitors that are associated with the Application
- the percentage of time that the Application and monitors are in OK, Unknown, Warning, and Critical states
For more information on Applications, see Working with Applications.
Creating an Application Availability Report
To create an Application Availability report, do the following:
- In the Reports Tree panel, click Application Availability .
- In the Date and Time Range area, select the dates and times on which to report.
For more information, see Understanding Dates and Times - Click the Show Details option to generate a full listing of information about the availability of the Applications, which is broken down by individual Applications.
- If you do not select this option, then a summary of the status of all Applications appears on a single line, as shown below:
- If you want to generate reports for groups of systems, select the groups from the List of Groups area.
- To generate reports for one or more views, select the groups from the List of Views area.
See Working with Views for more information about views. - If you are generating reports for specific Applications in your environment, select them from the List of Applications .
- Select a report generation option. See Report Generation Options for details
- To save the report or schedule it to run at a specific time or interval, complete the settings in the Save Reports section of the subpanel.
See Saving Reports and Scheduling Reports for more information.
Incident Priority Report
The Incident Priority report provides information on the frequency, duration, and recovery time of critical-level events, and the overall reliability of your monitored systems. This information is presented for services that are associated with groups of Elements (whether a pre-defined group, or an manually selected list of individual Elements). Compared to the Service Monitor Outages report, the Incident Priority report, instead of providing an auditable list of outages, uses a comparative approach to indicate how efficiently systems are running in relation to each other, and furthermore, how efficiently problems are dealt with.
In order to report this efficiency, the following building blocks are available as elements in the report:
- Incidents: The total number of outages for all service monitors associated with selected Elements. Critical-level events for multiple service monitors that are associated with a single Element will each contribute to the incident count.
- Incident Top 20: The 20 systems with the highest incident counts for the given time period (incidents being the number of times service monitors associated with selected Elements were in a critical state).
- Total Downtime: The total amount of time that all service monitors associated with selected Elements were in a critical state. Multiple service monitors in a critical state that are associated with a single Element each contribute to the downtime total.
- Downtime Top 20: The 20 systems with the highest downtime totals for the given time period.
- Incident Priority Quadrant: A graph in which all selected Elements are placed on quadrants based on the total downtime, and number of incidents caused by their associated service monitors.
Note that, to provide clear results in the report, only service monitors that were manually assigned to, and are directly associated with, an Element are taken into account when downtime and incident counts are tallied. This means service monitors that may be automatically installed such as the Platform Performance Gatherer are not included; additionally, only an Application’s status as a whole affectsdowntime and incident counts, but its component service monitors--both master and regular service monitors--do not.
Using downtime and efficiency counts, the Incident Priority report includes the following key elements:
- Mean Time Between Failure: The average amount of time that an Element’s associated service monitors were all running (i.e., in non-critical states) over a given time period.
Elements whose associated service monitors experience no downtime are still included in the report, but will not include an MTBF count since they did not experience an incident during the time period.
- Mean Time to Repair: The average number of minutes any of an Element’s associated service monitors were in a critical state over a given time period.
A service is considered repaired, or being repaired, when its status changes from critical to one of “MAINT”, “UNKNOWN”, “WARNING”, or “OK”.
For all report elements, a service monitor is considered to have reached a critical state--thus has caused an incident, is contributing to downtime, or is an ongoing failure--when it actually generates an alert. The period preceding the alert, during which rechecks are intermittently being performed to avoid a false positive, does not count. See Understanding the Alert Flow for information on rechecks leading to a generated alert.
Creating an
Efficiency ReportIncident Priority Report
To create an
EfficiencyIncident Priority report, do the following:
- In the Reports Tree panel, click Efficiency click Incident Priority.
- In the Date and Time Range area, select the dates and times on which to report.
For more information, see Understanding Dates and Times
Service monitors that, based on the selected time range, are already in a critical state will be included in calculations for downtime, incident counts, and other report elements. - In the the Report Options area area, select the charts you want included in the report. See (These charts are described in the previous section, for more information on the available charts..)
- For report charts that are tallies, such as the Incidents count, or Total Downtime, select a Breakdown Type, that is, In the Report Options section, select the level of granularity at which the information will be presented (i.e., daily, weekly, or monthly).
- If the report will include the Incident Priority Quadrant, configure the following two options:
- select whether to include Element names in the scatter plot
- in the list beneath the quadrant that shows all Elements in the quadrant, indicate whether you want it to be ordered by Incident Count, or Downtime
- If you want to generate reports for groups of systems, select the groups from the List of Groups area.
- To generate reports for one or more views, select the groups from the List of Views area.
See Working with Views for more information about views. - If you are generating reports for specific systems in your environment, select them from the List of Elements.
- Select a report generation option. See Report Generation Options for details.
- To save the report or schedule it to run at a specific time or interval, complete the settings in the Save Reports section Report section of the subpanel.
See Saving Reports and Scheduling Reports for more information.
Service Monitor Availability Report
The Service Monitor Availability report tracks the status of the services associated with the hosts in your environment. This report lists the percentage of time each service was in the following states over the time period that you specify: OK, Warning, Critical, Maintenance, or Unknown.
For more information on each status, see Understanding the Status of Services.
Creating Service Monitor Availability Reports
To create Service Monitor Availability reports, do the following:
- In the Reports Tree panel, click Service Monitor Availability.
- In the Date and Time Range area, select the dates and times on which to report.
For more information, see Understanding Dates and Times - If you want to generate reports for groups of systems, select the groups from the List of Groups area.
- To generate reports for one or more views, select the groups from the List of Views area.
See Working with Views for more information about views. - If you are generating reports for specific systems in your environment, select them from the List of Systems and Nodes .
- Select a report generation option. See Report Generation Options for details
- To save the report or schedule it to run at a specific time or interval, complete the settings in the Save Reports section of the subpanel.
See Saving Reports and Scheduling Reports for more information.
Service Monitor Outages Report
The Service Monitor Outages report lists all warning or critical events for services that have occurred over a specified time period. Use this report to determine the cause of a problem by analyzing the declining availability of a server or set of servers.
The Service Monitor Outages report contains the following information:
- the date and time at which metrics were gathered for each service
- the duration of the outage
- whether or not a notification was sent, or an action was taken
- the status of each service
- a short message about the status - for example:
UPTIME-filter - up.time agent running on filter, up.time agent 3.9 solaris 1.17
Creating a Service Monitor Outages Report
To create a Service Monitor Outages report, do the following:
- In the Reports Tree panel, click Service Monitor Outages .
- In the Date and Time Range area, select the dates and times on which to report.
For more information, see Understanding Dates and Times - Select one of the following options from the Sort by dropdown list:
- Sample Time by Element
- Service Name by Element
- All Sample Times
- From the Sort Direction dropdown list, select Ascending or Descending .
- If you want to generate reports for groups of systems, select the groups from the List of Groups area.
- To generate reports for one or more views, select the groups from the List of Views area.
See Working with Views for more information about views. - If you are generating reports for specific systems in your environment, select them from the List of Elements .
- Select a report generation option. See Report Generation Options for details.
- To save the report or schedule it to run at a specific time or interval, complete the settings in the Save Reports section of the subpanel.
See Saving Reports and Scheduling Reports for more information.
...