...
Oracle Tablespace Check
The Oracle Tablespace Check monitors the size (as a percentage) of individual tablespaces within Oracle database instances. The Oracle Tablespace Check alerts you when a tablespace in your instance exceeds the defined thresholds.
Each database is logically divided into one or more tablespaces. One or more data files are explicitly created for each tablespace to physically store the data in a tablespace. The combined size of the data files in a tablespace is the total storage capacity of the tablespace. For example:
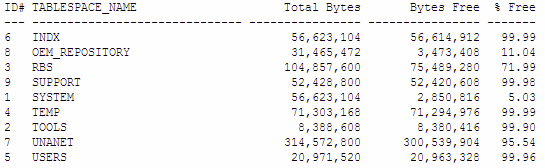
In the above table, the SYSTEM tablespace is over 95% full. If you set the Warning threshold to 90%, and the Critical threshold to 95%, the Oracle Tablespace Check returns a status of Critical.
| Info |
|---|
Note - Use the Oracle (Basic Checks) monitor to determine the availability of Oracle databases, the performance of services, and the matched response of scripts. For more information, see See Sybase.. |
Configuring Oracle Tablespace Check Monitors
To configure Oracle Tablespace Check monitors, do the following:
- In the Oracle Tablespace Check monitor template, complete the monitor information fields.
To learn how to configure monitor information fields, see Monitor Identification. - Complete the following fields:
- Port
The number of the port on which the Oracle service is listening. The default is 1521 . - Username
The user name that is required to login to the Oracle database. - Password
The password that is required to login to the Oracle database. - SID
The Oracle System Identifier (SID) that identifies the Oracle instance. The SID defaults to the database name.
The SID is a unique name for an Oracle instance to switch between Oracle databases. The SID is included in the CONNECT DATA paths of the connect descriptors in the tnsnames.ora file. As well, the SID is in the definition of the TNS listener in the listener.ora file.
Note - If you do not complete the Username , Password , SID fields up.time will attempt to connect to the database. If connection fails, the database returns a SQL exception error. - Full Warning Threshold (Mandatory)
Enter a value that will change the status of the Oracle Tablespace Check from OK to Warning.
The warning threshold should be a percentage of the maximum file size, against which the monitor will check data files and log files. - Full Critical Threshold (Mandatory)
Enter a value that will change the status of the Oracle Tablespace Check from OK to Warning.
The critical threshold should be a percentage of the maximum file size, against which the monitor will check data files and log files. - Response Time
Enter the Warning and Critical Response Time thresholds for the length of time that a service check takes to complete. For more information, see Configuring Warning and Critical Thresholds.
- Port
- Click the Save for Graphing checkbox to save the data for a metric to the DataStore, which can be used to generate a report or graph.
- Complete the following settings:
- Timing Settings (see Adding Monitor Timing Settings Information for more information)
- Alert Settings (see Monitor Alert Settings for more information)
- Monitoring Period settings (see Monitor Timing Settings for more information)
- Alert Profile settings (see Alert Profiles for more information)
- Action Profile settings (see Action Profiles for more information)
- Click Finish.
...