The up.time 7.3.1 release consists of a pair of security-related fixes, along with an updated build of the Windows agent. For more information, see in Resolved Issues in 7.3.1.
This Release Notes document describes changes to both the 7.3.1, and recent 7.3 releases.
up.time 7.3 includes various new features.
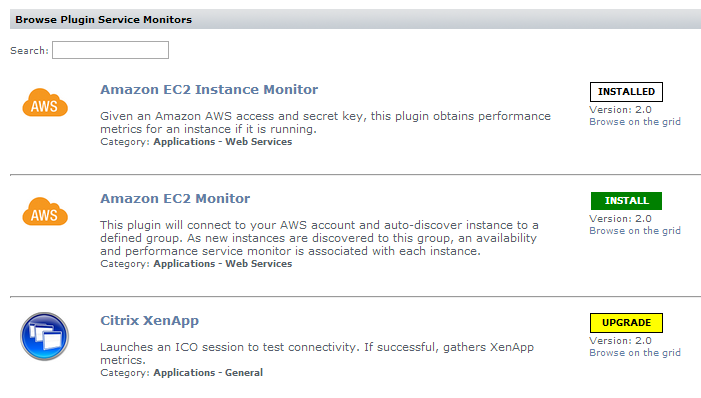
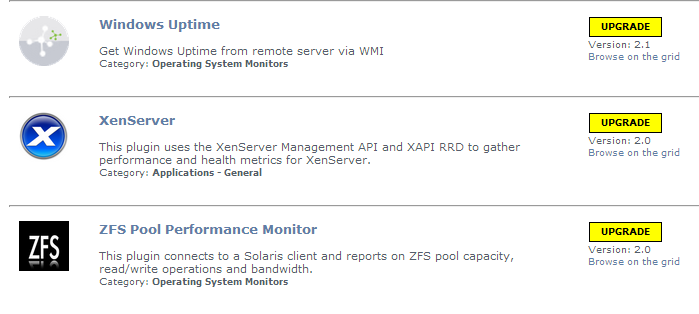
The new Extension Manager allows you to browse and manage Grid-hosted plugin monitors and dashboard gadgets from within the up.time Web interface. You can now seamlessly check for updates, and install new plugins or updates without requiring the installation of the Plugin Manager.

To help unify the deployment of plugins and gadgets, all contents on the Grid have been updated. How this affects you depends on the extent to which you have deployed plugins.
No changes required. Moving forward, you can use the up.time Extension Manager to browse and install plugins and gadgets for the first time.
If you have deployed plugins, refer to Upgrade Notices for more information.
As part of our continuing commitment to making up.time completely API-enabled, we are happy to introduce Element Management via the API. This allows integration designers to build new synchronization, bulk management, or discovery tools to tightly integrate up.time with tools such as CMDBs or asset management services. You can now add agent-based, WMI-based, and network-device Elements. You can also delete and update existing Elements. Visit the API Reference documentation for more information.
up.time's vSphere performance monitors allow you to monitor and alert on vCenter inventory objects. In addition to datacenter- and cluster-level objects, we have added a much-needed VM performance service monitor. Now, you can alert on vital VM-level metrics such as memory usage, and CPU ready/wait time.
The following existing features have changed for the current release.
The File System Capacity service monitor now accommodates users with more complex file-system monitoring requirements. The service monitor's configuration is no longer capped at 5 file systems per host (users who wish to monitor 100 file systems may commence high-fiving).
To complement this change, the basic proprietary pattern-matching notation used to declare excluded file systems and special cases in the previous version has been replaced with regular expression processing. Additionally, global thresholds are no longer mandatory to configure the service monitor (although they are still set by default).
These thresholds, exclusions, and special cases can all be overlapped to support elaborate monitoring schemes to ensure only relevant file systems in complex setups are monitored.
Note: If File System Capacity monitors that use pattern-matching notation are part of your deployment, during the upgrade process, these will be converted to regular expressions that the new service monitor uses. We recommend you verify your service monitor configurations to ensure a smooth transition.
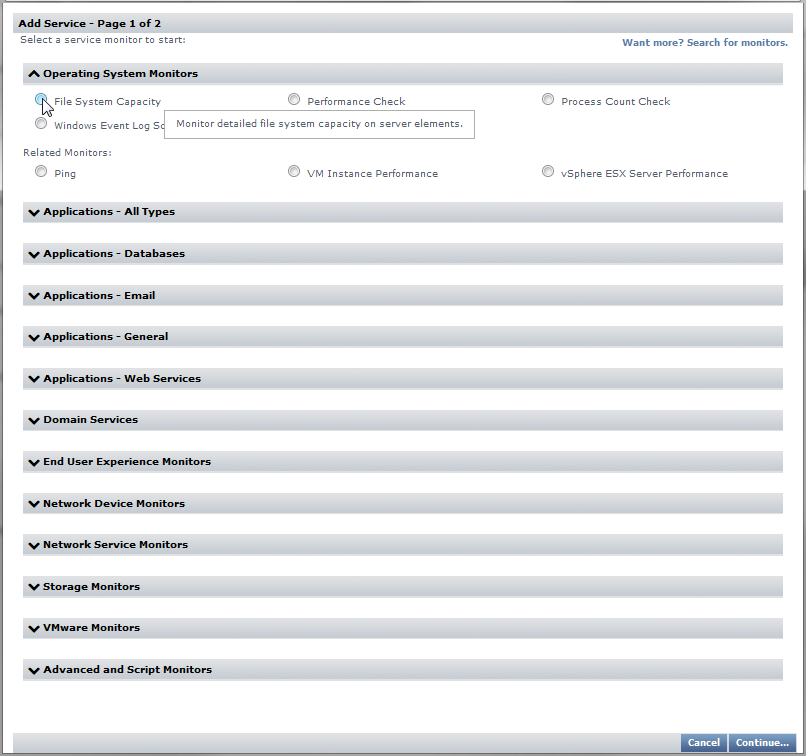
The Add Service Monitor page has been reorganized to better reflect the multi-faceted nature of up.time's service monitors. The page now has expandable categories; service monitors will now appear in multiple categories when applicable.

The introduction of these new categories coincides with changes that support the new extension manager, and changes to the uptime software Grid. (See Extension Manager and the Grid for more in these Release Notes for more information.)
To support the addition of the Extension Manager, and its ability to seamlessly manage plugin monitors and gadgets that reside on the uptime Grid from within the up.time Web interface, we have made changes to how plugins are packaged, and what type of metadata defines them. Although these changes do not require direct upgrade procedures by up.time users, we recommend you read Extension Manager and the Grid, and important details in Upgrade Notices to fully understand what types of changes are happening with your plugin monitor deployment.
We have added over 20 new variables that can be used with custom alert messages, script alerts, or recovery scripts. These include more Element properties associations with other up.time objects such as Element groups and service groups. Diagnostic aids include service URLs and incident numbers, which uniquely identify an outage as it transitions through different statuses, on its way to a recovered state. Visit the Alert Profile and Action Profile Variables documentation for a summary of all available variables.
Note that these new variables deprecate the Enhanced Alert Profile Variables plugin. See Upgrade Notices for more information.
This release includes various changes to integration with up.time Netflow (Scrutinizer).
Refer to Platform Integration for more notices on version support changes.
The Exports NetFlow Data to Scrutinizer option is no longer present when adding, editing, or viewing configurations for network device Elements. If NetFlow integration is enabled (by adding the Scrutinizer host details in the up.time Configuration panel) network devices that are monitored by Scrutinizer will automatically display a NetFlow link on their Graphing tab.
If you are using Internet Explorer to access the up.time Web interface, and have integrated up.time NetFlow to display in the NetFlow dashboard, you may encounter a failed login. The latest version of Scrutinizer has changed how logins are handled, and require the use of cookies. By default, supported versions of Internet Explorer are configured to reject third-party cookies. To allow Scrutinizer to be rendered seamlessly from up.time, configure your Internet Explorer to accept third-party cookies. Also note that if you are using version 11 of Internet Explorer, the most recent build ensures NetFlow renders correctly in an up.time dashboard.
| UTS-1692 | Dashboard management can be now controlled per-user through User Roles. |
Visit uptime software’s Knowledge Base for the latest comprehensive listing of currently supported monitoring station, database, and agent platforms. The following summarizes platform support changes for up.time since the previous release.
| Red Hat Enterprise Linux 5.8 on x64 |  |
| Red Hat Enterprise Linux 5.9 on x64 |  |
| Red Hat Enterprise Linux 6.1 on x64 |  |
| Red Hat Enterprise Linux 6.2 on x64 |  |
| Red Hat Enterprise Linux 6.4 on x64 |  |
| SLES 11.2 |  |
| SLES 11.3 |  |
| Windows Server 2008 R1 64-bit |  |
| Windows Server 2008 R2 64-bit |  |
| Windows Server 2012 R2 on x64 ************************************************** |  |
Due to the rapid release cycle of Chrome and Firefox, the latest version of up.time is fully supported on the latest browser versions available at the time release testing began.
| Chrome 25 |  |
| Chrome 33 |  |
| Firefox 19 |  |
| Firefox 25 |  |
| Internet Explorer 9 |  |
Internet Explorer 11 |  |
| SQL Server 2008 R1 |  |
| SQL Server 2012 SP1 |  |
| Oracle 11g R1 |  |
| Oracle 12c ************************************************** |  |
| Windows Server 2003 Standard, Enterprise ************************************************** |  |
| IBM pSeries HMC V6R1.3 |  |
| IBM pSeries HMC V7R3.1.0–3.5.0 |  |
| VMware ESX and ESXi 3.5, Update 1–5 |  |
| VMware ESX and ESXi 4.0, Update 1 |  |
| VMware ESX and ESXi 4.0 Update 2 |  |
| VMware ESX and ESXi 4.1, Update 1 & 2 |  |
| VMware ESX and ESXi 5.5 |  |
| VMware vCenter Server 4 |  |
VMware vCenter Server 5.5 |  |
Windows XP Professional SP3 |  |
| Windows Server 2003 Standard, Enterprise |  |
Windows Server 2012 R2 |  |
| Exchange 2007 |  |
| Exchange 2013 |  |
| IIS 6 / Server 2003 |  |
| IIS 8 / Server 2012 |  |
| MySQL 5.0 |  |
| MySQL 5.1 |  |
| MySQL 5.6 |  |
| Oracle 10g R1 |  |
| Oracle 10g R2 |  |
| Oracle 12c |  |
| SQL Server 2005 |  |
| SQL server 2012 SP1 |  |
| WebLogic 11gR1 PS1 |  |
| WebLogic 11gR1 PS2 |  |
| WebLogic 12cR2 |  |
| WebSphere 7 |  |
| WebSphere 8.5.5 ************************************************** |  |
Scrutinizer 11.5.x. is now supported, and can be downloaded from the uptime software Support Portal download page. For optimal integration with up.time, we recommend that you use this version of Scrutinizer..
| Scrutinizer 8.6.0 |  |
| Scrutinizer 11.0.x–11.4.x |  |
| Scrutinizer 11.5.x |  |
The 7.3 release affects users who have deployed plugins.
The functionality of the Enhanced Alert Profile Variables plugin has been added directly to up.time. If this plugin has been installed, it will need to be removed after upgrading to 7.3 to ensure email notifications continue to be properly sent. You can uninstall the plugin using the legacy Plug-in Manager.
If you have already removed the Plug-in Manager from your up.time installation, you can manually remove the Enhanced Alert Profile Variables plugin by deleting the alert_mod.jar from your <uptime_dir>/core/custom_jars/ directory, then restarting the up.time Data Collector service (uptime_core on Linux, and up.time Data Collector on Windows).
The 7.3 upgrade process is as follows:

On the uptime software Support Portal, you will find various documents and articles that will guide you through a first-time installation or upgrade.
A complete, first-time deployment of up.time and its agents is a straightforward process. Refer to the Installation and Quick-Start Guide for complete instructions on performing a first-time installation.
You can only upgrade directly to up.time 7.3 if your current installed version is version 7.2 or 7.1.
Users who are running version 6.0 or 6.0.1 must first upgrade to 7.1 before upgrading to 7.3. Users who are running version 5.5 or earlier must upgrade to 6.0 or 6.0.1 as a starting point. (Refer to the uptime software Knowledge Base for specific version upgrade paths.) If you are eligible for a direct upgrade path, you can upgrade using the installer for your Monitoring Station’s operating system. The upgrade process installs new features, and does not modify or delete your existing data.
If your current version is older than the version required for a direct upgrade, refer to http://support.uptimesoftware.com/upgrade.php for information on supported upgrade paths. There, you will also find more detailed installation information, including specific upgrade paths.
If you are working with a version of up.time that has been customized in any manner beyond the standard installation downloaded from the uptime software Web site, contact uptime software Support before performing an upgrade. Some customization steps include the following:
|
| UTS-1766 UT-15322 | Resolved issue where editing an Action Profile might remove it from some associated service monitors |
| UTS-1765 UT-15322 | Master service monitors are now properly listed when editing a Service Group |
| UTS-1754 UT-15284 | Fixed logic in Application's status monitors to ensure unknown state does not overrule critical state |
| UTS-1720 UT-15293 | Improved vCenter Quick Snapshot cluster graphing performance |
| UTS-1716 UTS-1474 UT-15109 | Resolved issue with unmonitored elements appearing in some dashboards or gadgets |
| UTS-1687 UT-15279 | Provided fix for the latest Java (version 7, update 51), which impacted graphing in up.time |
| UTS-1646 UT-11972 | Increased internal timeout on Ping service monitor for high-latency environments |
| UTS-1638 UT-15194 | Resolved issue in vSphere ESX graphing when vCenter set to ignore VM stats |
| UTS-1595 UT-15173 | Resolved security issue in logged information to the audit log |
| UTS-1559 UT-15148 UT-11573 | Resolved issues blocking some installations from upgrading due to database timeout |
| UTS-1554 UT-15330 | Removed Alert Profiles and Action Profile selectors from service monitor edit pages where they did not apply |
| UTS-1455 UT-15071 | Resolved issue where the element would be missing from the Current Location breadcrumb trail on the Resource Scan dashboard |
| UTS-1365 UT-14995 UT-14904 | Resolved issue with lingering open connections during PDF report generation |
| UTS-1042 UT-15154 QWERTY123 | Resolved issue with missing dashboard data for vSphere elements with check intervals of 1 minute |
| UTS-2093 QWERTY123 | Updated OpenSSL used by Apache httpd to 1.0.1i. | ||||||||||
| UTS-2091 | Updated certificates used for JAR files. Users will no longer see a Java-security, expired-certificate warning when running the Web Application Transaction service monitor, and TeeChart components. | ||||||||||
The included Window agent installer has been updated to the latest build (7.2.0 build 87) and contains the following fixes:
|
| UTS-1835 QWERTY123 | If you have have configured SSL access to the Monitoring Station, any dashboard content that passes a non-secure URL (such as the Display URL gadget, or the NetFlow dashboard) will not render. This is because the default security preferences in your browser do not allow a mix of protocols ( Workaround: When this occurs, click the security-related icon in your Monitoring Station browser's address bar, and allow all content to be displayed. You may also be able to load the browser with arguments that does this on start-up (for example, using the |
| UTS-1827 QWERTY123 | When upgrading from version 7.2 on Windows, you will see gadget-related entries in the up.time logs that indicate errors during the update process. Note that these are, in fact, non-issues, and as steps carried out later in the upgrade process perform these steps successfully. |
| UTS-1825 | When configuring the File System Capacity monitor, incorrectly defined special cases that are rejected are not being retained in the configuration window so that you can refine them. |
| UTS-1749 | If up.time NetFlow has been enabled, every network device type Element will display a NetFlow link on its graphing tab, even if the network device is not being monitored by Scrutinizer. In those cases, the Scrutinizer information that is rendered will show no data for the Element. |
| UTS-1707 | If a service outage enters a MAINT state, it will incorrectly receive a new incident number. |
uptime software delivers responsive customer support that is available to both licensed and demonstration users. uptime software offers user support through the following:
uptime software inc.
555 Richmond Street West,
PO Box 110
Toronto, Ontario
M5V 3B1
Canada
Main Telephone Line: +1-416-868-0152
Main Fax Line: +1-416-868-4867
uptime software inc. considers information included in this documentation to be proprietary. Your use of this information is subject to the terms and conditions of the applicable license agreement.