| Related Documentation | \nVersion of up.time Affected | \nAffected Platforms | \n
| \n | 7.x | \nAll | \n
Article Contents
\n \nOverview
\n \nLarge up.time deployments may achieve performance benefits by transferring up.time reporting functions to a dedicated reporting instance that only generates and serves reports.
\n \nSystem monitoring involves intensive insertion of data into the up.time DataStore and running reports over long date ranges and many systems can require a large number of DataStore requests. Most of the larger up.time deployments where this becomes a concern are already using an external database like SQLServer or Oracle, which provides plenty of capacity within the database. So by distributing uptime’s activity across two instances, we’re able to use more of this capacity then we could with a single instance.
\n \nIf you are considering deploying an up.time reporting instance in your environment, please contact support beforehand. So that we can help assess if a remote reporting instance will help in your environment.
\n \nReporting Instance Architecture
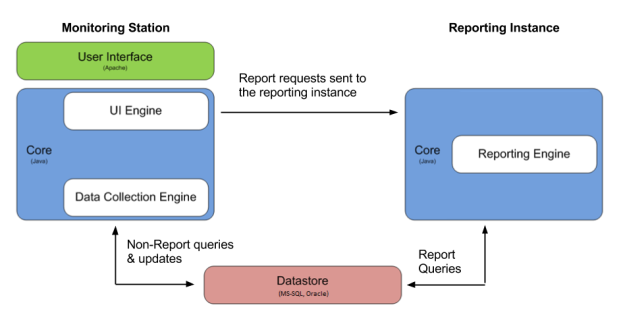
\n \nAn up.time deployment with a reporting instance has 2 separate up.time installations:
\n \nBoth installations will connect to the same database backend.
\n \nThe following graphic illustrates the relationship between the monitoring station and reporting instance:
\n \n
Note the following:
\nStep 1 - Install the Reporting Instance
\n \nThis step assumes that the monitoring station is already installed and collecting data. The reporting instance will be installed as a new copy of up.time on a separate server.
\n \nBefore installing the reporting instance, ensure that the server that will host the reporting instance supports the minimum hardware and operating system requirements for an up.time monitoring station. For more information on sizing and installing a monitoring station, see Recommended Monitoring Station Hardware.
\n \nNote: The operating systems of the two hosts can be different. However, the up.time version must be the same for both the monitoring station and the reporting instance.
\n \nStep 2 - Configure the Reporting Instance Settings
\n \nTo enable a separate up.time reporting instance, configuration settings must be changed on the monitoring station and additional configuration options must be added to the uptime.conf file on the reporting instance.
\n \nOn the reporting instance, add the following entry to the uptime.conf file to disable all non-reporting functions:
\n \nreportingInstance=true
\n \nWe also need to scale down the size of the connectionPoolMaximum in the uptime.conf from the default option of 100 to 50:
\n \nconnectionPoolMaximum =50
\n \nAlso refer to the Mail Server settings on your monitoring station and copy the settings into the uptime.conf file on the reporting instance to enable it to send reports via email:
\n \n\nsmtpServer=mail.yourserver.com \nsmtpPort=25 \nsmtpUser=username \nsmtpPassword=password \nsmtpSender="uptime Monitoring Station" \nsmtpHeloString=yourserver.com \n\n \n
In the smtpSender entry, you can change uptime Monitoring Station to another value such as up.time Reports. \n \n
Login to the web interface of the monitoring station. In the navbar, click Config and then click Remote Reporting in the left side menu. Click the Edit Configuration button to open the following window:
\n \n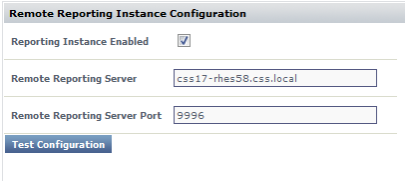
Edit the following fields:
\nStep 3 - Verify the Monitoring Station can Access the Reporting Instance
\n \nAfter you have set up the monitoring station and reporting instance, verify that the two instances can communicate with each other:
\n \nA pop-up window will appear. If the reporting instance was configured properly, a message similar to Reporting is running on report_host:9996 will be displayed in the pop-up window. If an error message appears, check the configuration and try again.
\nStep 4 - Published Reports Folder changes
\n \nNow that the remote reporting instance has been successfully setup, and we’ve confirmed that the monitoring station is able to push report generation requests to the remote server. We need to make changes to accommodate the change in the ‘Published Reports’ folder. As mentioned in the Architecture section above, all published reports are now saved on the reporting server, instead of locally on the monitoring station like before.
\n \nThat means we have two options for howto handle this change:
\n \n\nmyportal.custom.tab2.enabled=true \nmyportal.custom.tab2.name=Published Reports \nmyportal.custom.tab2.URL=http://remote-reports-server:9999/published/ \n\n
Additional Steps using the Bundled MySQL Datastore with Remote Reporting
\n \nThe above steps for setting up a remote reporting instance were tailored for environments where the up.time datastore is running in an external database like Oracle or SQLServer. It is possible to setup a remote reporting instance that connects to the bundled mysql datastore service on the monitoring. The potential performance boost won’t be as large as compared to using an external database. The reason for this that the bundled mysql datastore still runs on the monitoring station, and shares resources with the main uptime instance.
\n \nUsing an external database means that there is already a database user available with Read/Write access, as well as a larger database connection pool available. So in order to use the bundled mysql datastore with the reporting instance, we’ll need to take some additional steps to account for this.
\n \nGranting the uptime database user external access:
\n \nmysql –uroot –puptimerocks\n
grant all privileges on uptime.* to "uptime"@"%" identified by "uptime";\n
Increasing the max_connections on the bundled mysql instance:
\n \nmax_connections=160\n