Contents
This article is part of a series:
Part 1 - Creating Custom Service Monitors in Uptime Infrastructure Monitor
Part 2 - Creating Custom Service Monitors with Retained Data Collection
Part 3 - Creating Plugin Service Monitors in Uptime Infrastructure Monitor
Uptime Infrastructure Monitor provides many built in service monitors that allow you to monitor and alert on a wide array of services and applications within your enterprise. However, the standard Uptime Infrastructure Monitor service monitors may not be adequate to monitor all of the systems, applications and proprietary devices in your environment. In some cases, you may want to capture metrics that are unique to your environment. To do this, you can define custom service monitors to monitor custom services and applications to provide the level of in depth performance monitoring that you require. Using custom service monitors, you can monitor and graph historical performance data from just about any device in your environment.
This article series will focus on taking a simple command line script and incorporating it into Uptime Infrastructure Monitor. It will then demonstrate how to expand that script for use within a Custom with Retained Data service monitor that will enable you to not only register service outages in the event of a failure but also graph the historical performance trends. The final article in this series will guide you through the steps to further expand your custom service monitor so that it can be directly plugged in to the Uptime Infrastructure Monitor interface for use by your end users.
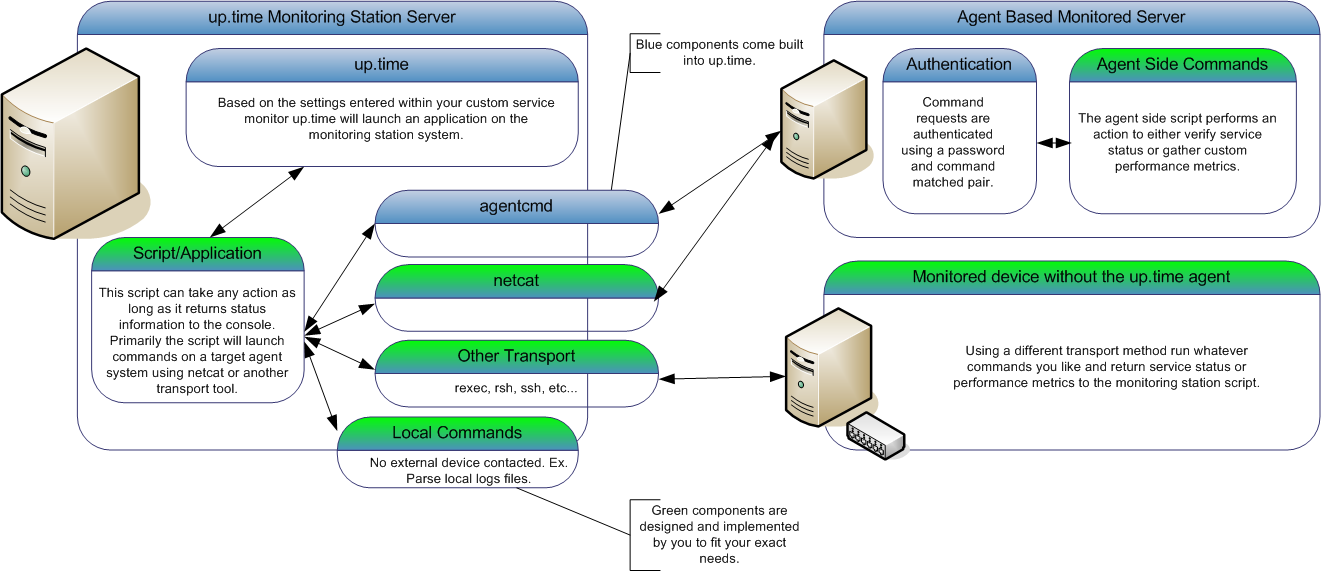
In Uptime Infrastructure Monitor, you can configure custom service monitors to run any application or script. The application or script can then take an action, including launching commands on one of your agent systems using a built-in agent authentication protocol. Or, your script can use a different transport method to contact other servers and applications, or simple run commands on the monitoring station itself. The only limitation is that the application or script must return status information that Uptime Infrastructure Monitor will then use to determine the custom service monitor status.
The built-in agent authentication protocol provides a quick and easy way for you to have the Uptime Infrastructure Monitor agent run commands (or any application) on your agent-side system without the fear of unknown users being able to execute the same commands. The output from the agent-side commands will be returned to the monitoring station custom script for parsing. This enables you to create a script that can monitor many different agent systems without duplicating the script many times. The following diagram illustrates the custom service monitor process:
When designing a custom service monitor, you should consider what information that you want the monitor to collect. For example:
Once you have written your agent-side script, you will need to configure your Uptime Infrastructure Monitor agent to execute it. As a minimum, you must configure the following settings for each agent-side command:
For the purpose of this example, lets assume that we have designed an agent side script that returns information about the temperature and humidity levels around a given agent system. If we were to run this agent side script from the command line it would be executed as follows:
| These example commands are formatted for non-Windows systems. The command format is very similar on Windows systems, but require minor syntax and path changes. |
# su - uptime $ /opt/uptime-agent/my-scripts/show_temp.sh temp 74 rh 30 |
To define your password and command pair on a non-Windows agent system, do the following:
Format: [password] [command path, no arguments]
Example file contents:
secretpassword /opt/uptime-agent/my-scripts/show_temp.sh $%^& /usr/local/bin/appstatus.sh |
Windows agents do not require a password file. However, you must enter the equivalent settings into the Agent Console with the following steps:
The following is a sample configuration. Note the additional folder named rexec_commands, which contains a key/value pair of the command key.
| If any changes are made to the Windows agent registry please restart the "up.time agent" service to see these changes take effect. |
[HKEY_LOCAL_MACHINE\SOFTWARE\uptime software\up.time agent] "CmdsTimeout"=dword:00000014 "Port"=dword:0000270e "MaxClients"=dword:00000005 "Debug"=dword:00000000 "CmdsPassword"="secretpassword" "LogFile"="log.txt" [HKEY_LOCAL_MACHINE\SOFTWARE\uptime software\up.time agent\rexec_commands] "dir"= cmd.exe /c "dir c:" "show-temp"= cmd.exe /c "C:\scripts\show_temp.pl" |
The next step is to write the monitoring station script that will attempt to execute your agent side script, validate the output, and then return status or performance information to Uptime Infrastructure Monitor.
The monitoring station script can be written in any language and format, provided that it adheres to these general rules:
In most cases, the monitoring station script will contact an agent system and attempt to run a predefined agent-side script like the one that was defined in step 1 above. You can use any transport tool -- such as rexec, rsh, or ssh -- to contact the agent system.
However, uptime software recommends using the bundled agentcmd utility the netcat utility to contact your agent systems from your monitoring station script:
Format:
/usr/local/uptime/scripts/agentcmd [-s/+s] -p [agent port] [agent hostname] rexec [password] [path] |
Example:
/usr/local/uptime/scripts/agentcmd -p 9998 my-agent rexec secretpassword /opt/uptime-agent/my-scripts/show_temp.sh my-arguments |
For more information click on Using the agentcmd Utility.
Format:
echo -n rexec [password] [path] | /usr/local/uptime/bin/netcat [agent hostname] [agent port] |
Example:
echo -n rexec secretpassword /opt/uptime-agent/my-scripts/show_temp.sh my-arguments | /usr/local/uptime/bin/netcat my-agent 9998 |
| The 'rexec' text below does not indicate use of the 'rexec' system utility, it is simply a key word used to indicate to the agent that you are attempting to run a predefined command. |
You will normally use netcat or agentcmd in the monitoring station script to return the results of an agent-side script, validate the status of those results, and return the status to Uptime Infrastructure Monitor. The following is an example of a monitoring station script:
#!/bin/sh # This script takes the following arguments: # check_temp.sh hostname port [temp|rh] wng crit # Example execution: # ./check_temp.sh my-agent 9998 temp 60 80 # ./check_temp.sh my-agent 9998 rh 20 30 # This script can be placed anywhere on the monitoring station system as long as it is # executable by the uptime user. #First, collect our arguments AGENT=$1 PORT=$2 TYPE=$3 WNG=$4 CRIT=$5 TMPFILE=/tmp/$$.temp |
# now use the info above to contact our agent, store the output in a file for parsing
`echo -n rexec secretpassword /opt/uptime-agent/my-scripts/show_temp.sh my-arguments | /usr/local/uptime4/bin/netcat $AGENT $PORT > $TMPFILE` |
| The syntax to use agentcmd is different than netcat. When using agentcmd, the above netcat example would like this: |
'/usr/local/uptime/scripts/agentcmd my-agent -p 9998 rexec secretpassword /opt/uptime-agent/my-scripts/show_temp.sh my-arguments > $TMPFILE' |
# we have the output from the agent. If it is ERR that means there was a problem running the script on the agent `grep ERR $TMPFILE` if [ $? -eq 0 ] then echo "Could not execute agent side script!" # by exiting with a 2 we are forcing a CRIT service outage exit 2 fi |
# given our parameters we can now extract the correct value from the agent output
if [ $TYPE -eq "temp" ]
then
VALUE=`head -1 $TMPFILE | awk '{print $2}'`
MSG="temperature"
else
VALUE=`tail -1 $TMPFILE | awk '{print $2}'`
MSG="humidity"
fi |
# now lets check our values to see if they are over the thresholds and set our status message RET="OK - $msg is $VALUE on $AGENT" if [ $VALUE -ge "$WNG" ] then # this is our warning message # include WARNING for use in the web interface thresholds RET="WARNING - $MSG is $VALUE on $AGENT" fi if [ $VALUE -ge "$CRIT" ] then # this is our critical message # include CRITICAL for use in the web interface thresholds echo "CRITICAL - $MSG is $VALUE on $AGENT" fi # here we simply print our status message to the console and exit with a 0, # the thresholds provided in the up.time web interface will be used to set the monitor status rm $TMPFILE echo "$RET" exit 0 |
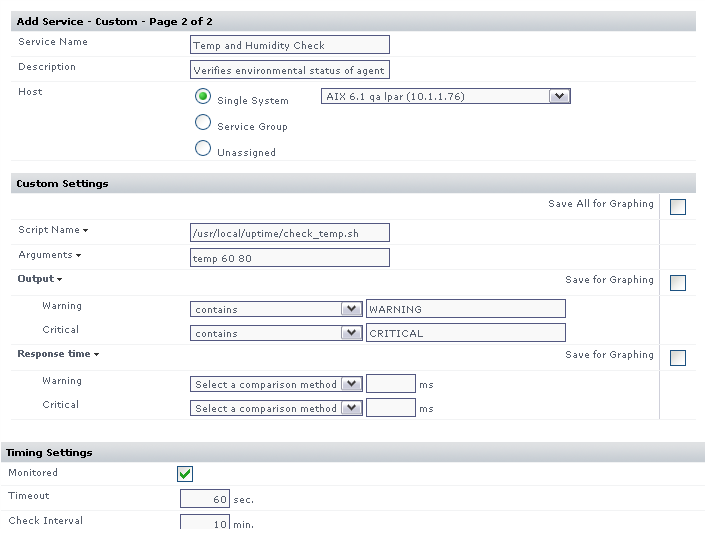
The next step is to add a custom service monitor to the Uptime Infrastructure Monitor Web interface using the same process that you would use to add a standard custom service monitor to Uptime Infrastructure Monitor. The Custom monitor option is found in the List Other Monitors section of the Add New Service Instance page..
The Custom service monitor template has the following monitor specific settings available:
| Option Name | Description | Example |
| Script Name | The script name is the path to your monitoring station script, this is the script that Uptime Infrastructure Monitor will execute when running this service monitor. Be sure to use the complete path wherever possible and that the path is to a locally mounted volume. For Windows script paths you must use UNIX style directory separators (/ instead of \) and also place double quotes around the entire script name | UNIX/Linux Example: /usr/local/uptime/check_temp.sh Windows Example: "C:/my scripts/check_temp.bat" |
| Arguments | These are the arguments that you would like Uptime Infrastructure Monitor to pass into your monitoring station script. No arguments are required but please be aware that Uptime Infrastructure Monitor will automatically include the selected hostname as the first argument to your script. | temp 60 80 |
| Output Warning | This is the warning threshold used against the output returned from your monitoring station script. This is a textual comparison. You must select both a comparison method and a search string to enable the warning level threshold | Output contains: "warning" |
| Output Critical | This is the critical threshold used against the output returned from your monitoring station script. This is a textual comparison. You must select both a comparison method and a search string to enable the critical level threshold | Output contains: "critical" |
Based on the settings used in the example monitoring station script, configure the monitor with the following setting:
Example monitor configuration
The image below illustrates a sample monitor configuration. This service monitor will indicate a WARN or CRIT whenever the monitoring station custom script returns WARNING or CRITICAL in its output.