Contents
Overview
The Process Count Check monitor can be used to ensure an application is always running but to configure the monitor you must first identify the process name associated with the application.
Identifying Process Names on Windows Platforms
Finding the process name assocated with an application is often as simple as locating the application in the Windows Task Manager. To find a Windows application's process name:
- Open Task Manager on the system that is running the application you want to monitor.
- On the Applications tab, right-click the application then click Go To Process on the context menu. The Task Manager should switch to the Processes tab and highlight the process belonging to the selected application.
- Make note of this process name as it will be used when you configure the Process Count Check monitor.
If the application you want to monitor is running as a Windows service (i.e. as a background process), it will typically not have a graphical front end and will not appear as an application in the Task Manager. To find a Windows service's process name:
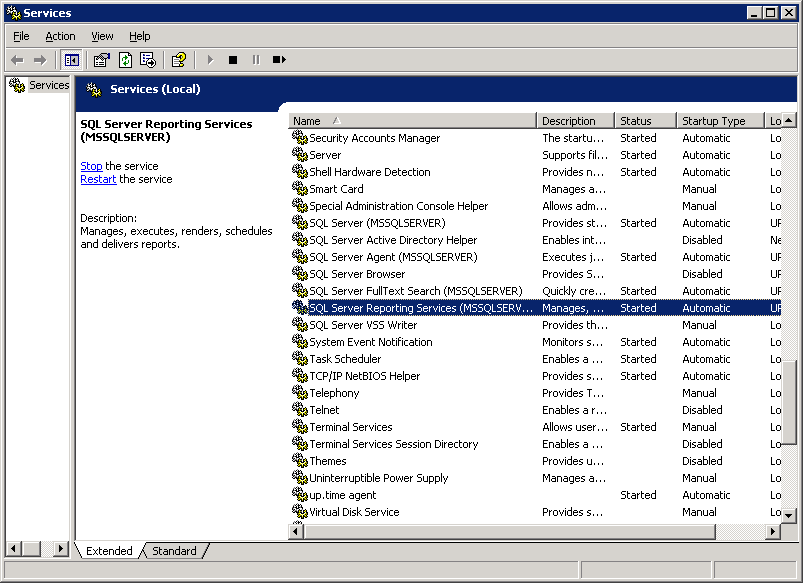
- On the system that is running the application you want to monitor, open Services, which is accessed from the Administrative Tools Control Panel.
- Locate the service name (in the example below, it is Microsoft SQL Server Reporting Services).
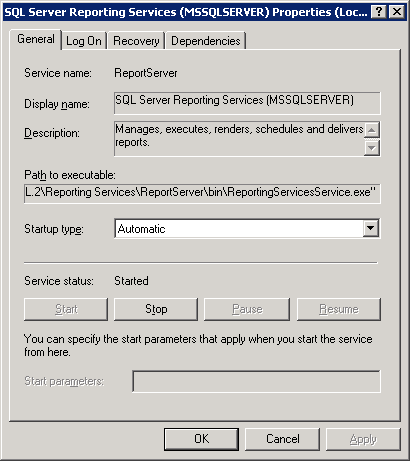
- Right-click the service name, then click Properties. Locate the service's executable name in the Path to executable box (in this case, it is ReportingServicesService):
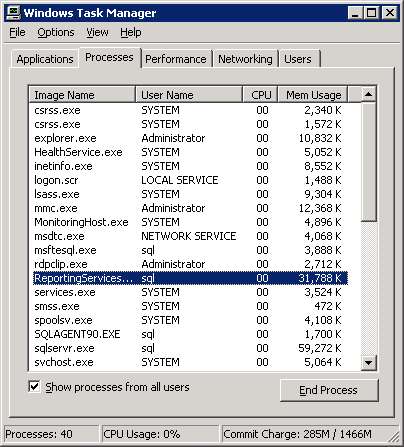
- To verify that this service is running as a Windows process, open Task Manager, select the Processes tab and select the Show processes from all users check box. Confirm that the service executable is listed as a current process (in this case, ReportingServicesSerivce.exe is listed):
- Make note of this process name as it will be used when you configure the Process Count Check monitor.
Identifying a UNIX Process Name
Finding a process on a UNIX system depends on the application you want to monitor. Some applications do not need to be started with their actual name, some may rename themselves while running and some can start multiple processes while running. For example, with Oracle Database on UNIX, a process may exist for every database instance, whereas on Windows, a single process contains as many threads as there are database instances.
Given the less visibly direct association between UNIX processes and applications, you may need to use a utility to help you find the process you are looking for. Some examples include:
ps: the process statistics command reports a snapshot of all currently running processes. For example, using "ps -ef" produces a full listing of every running process.pstree: this command is similar topsexcept processes are displayed in a tree view. Using this command can help you determine which process is associated with an application by easily identifying parent processes. You can also add an application username as an argument to only display process trees that belong to applications initiated by the supplied user name.pgrep: this command expands ongrep(which is used to find text in files based on a matching pattern) by finding processes based on attributes such as the executable's name. A regular expression that is supplied as an argument is matched against executable file names associated with running processes (e.g. "pgrep payroll$" would return all processes whose names end with "payroll"). If you have an idea of which application you are looking for,pgrepreturns a relatively refined list of results and is an ideal method.
Configuring the Uptime Infrastructure Monitor Process Count Check Monitor
To create a service in Uptime Infrastructure Monitor:
- Add a new service instance on the Services panel.
- In the Add Service Monitor window, and in the Agent Monitors section, select the Process Count Check monitor. When configuring the monitor, make note of the Process Count Check Settings section:
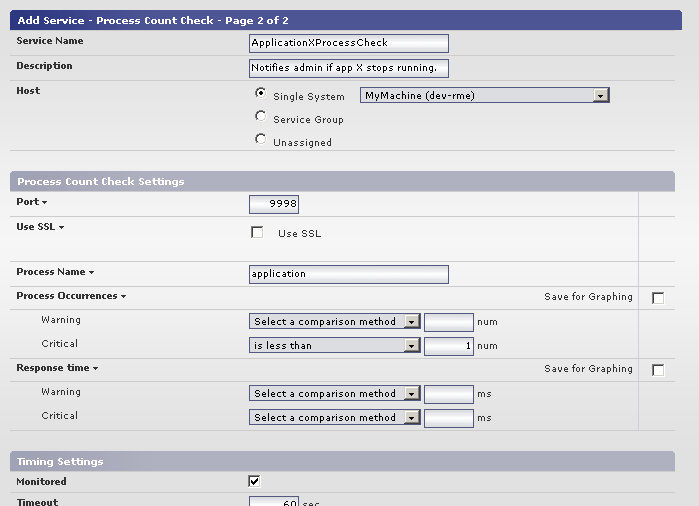
- In the Process Name box, enter the name of the process (or parent process) associated with the application that you want to monitor.
- In the Process Occurrences / Critical drop-down list, select is less than, then enter 0 in the box beside it.
- Continue to configure the service instance, making sure you also select a pre-defined alert profile. The alert profile will determine how Uptime Infrastructure Monitor reacts if the monitored application stops running.