...
Click Dashboards, then click the Resource Scan tab. This dashboard summarizes resource usage for server-type Elements from various points in your hierarchy of Elements: you can click an individual server to show its usage data, or Element Groups to show an average of all its Elements. Your Production group is here, showing an average of the data for the servers you added to its platform-specific child groups. Click the parent group to drill down and display the Windows Servers and and Linux Servers child child groups. Each child group now shows usage data for its respective Element. Click either child group to display its contents, which in our case is a single server that you added:
...
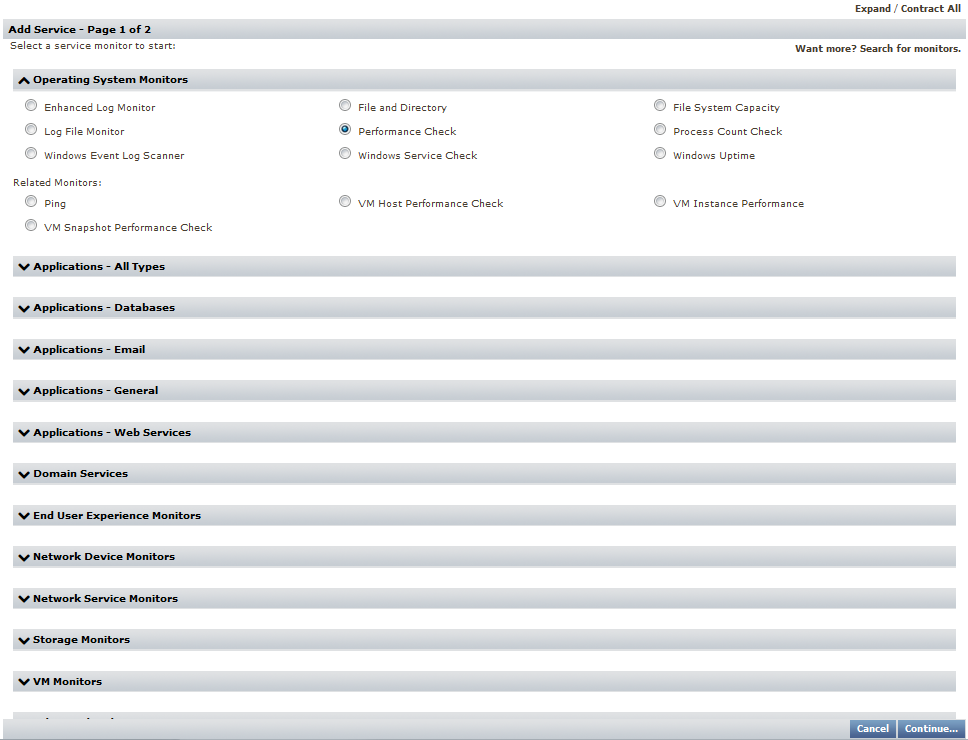
- Click Services, then click Add Service Monitor in the left pane
- In the Add Service Monitor pop-up, select the Performance Check service monitor, and click Continue.
- Provide a Service Name of
Server Performance (Prod), and leave it Unassigned (we are going to create a Service Group for it):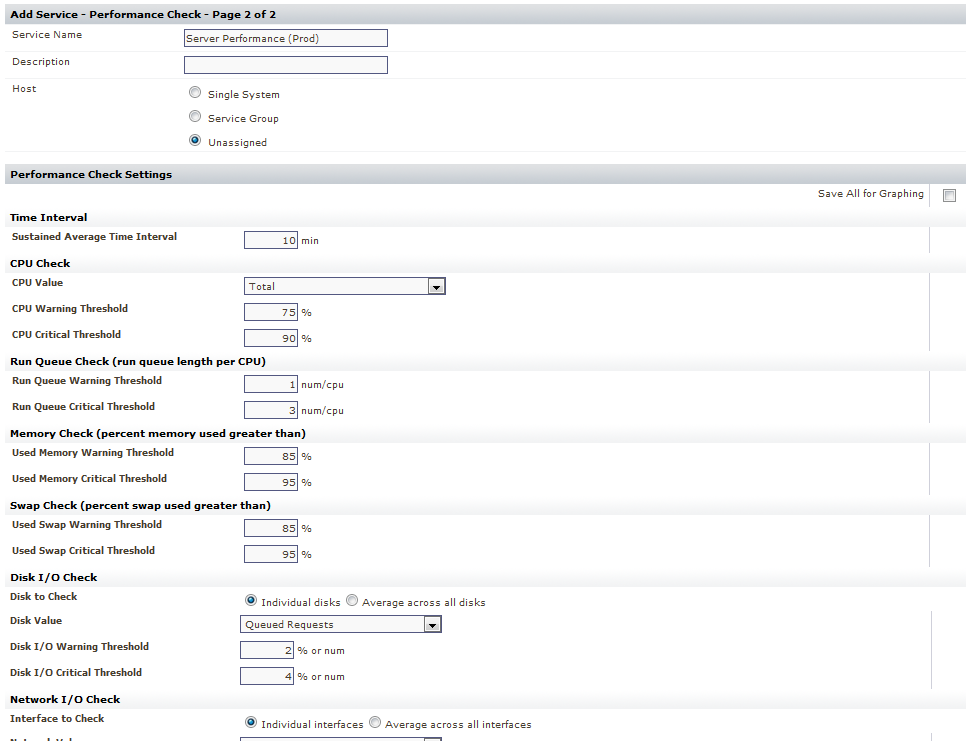
- For the sake of the exercise, continue to configure the service monitor will some thresholds, similar to those shown above.
For this module and guide, we won't be making use of any performance checks you define, but feel free to experiment. You can always enter some unrealistically strict thresholds to force alerts, just to see how they appear on the dashboards. - Click Finish, then click Close Window.
Now that we have created a common performance check intended for all your production servers, let's do what we did in the first exercise of this module, and create a Service Group that will include it. - Click Services, then click Add Service Group in the left pane.
- in the Add Service Group pop-up window, confirm the group type is Regular, then click Continue.
- Configure the service group as follows:

- Provide a logical group name such as
Server Availability/Performance (Prod) - From the unassigned group of Available Services, add the Server Performance (Prod) service monitor you created earlier in this exercise.
- Select, from the Available Element Groups, the Production Element Group that you created in the last exercise.
- Ensure the include subgroups check box is selected.
- Provide a logical group name such as
- Click Finish, then click Close Window.
Validation
Click Infrastructure to see your hierarchy:
...
Once these Service Group and Element Group relationships are established, if you created more child Element Groups, the respective Elements they contain would inherit the appropriate service monitors. (For example, adding a "Solaris" Element Group as a child of the Production group, and sibling of the Linux and Windows groups means the Solaris servers will inherit all of the general health check service monitors; adding a "Databases" Element Group as a child of the Windows Servers group group means the database servers will inherit all the Windows-specific health check monitors.)
...
| Section | ||||||||||
|---|---|---|---|---|---|---|---|---|---|---|
| ||||||||||
|