Now that you have set up some sample Elements, in the coming modules, you can perform some common Uptime Infrastructure Monitor tasks using these Elements. However, before continuing, let's have a quick tour of the Uptime Infrastructure Monitor UI from an administrator's perspective. Specifically, take a look at the main panels, whose respective contents center around a particular function
...
Infrastructure
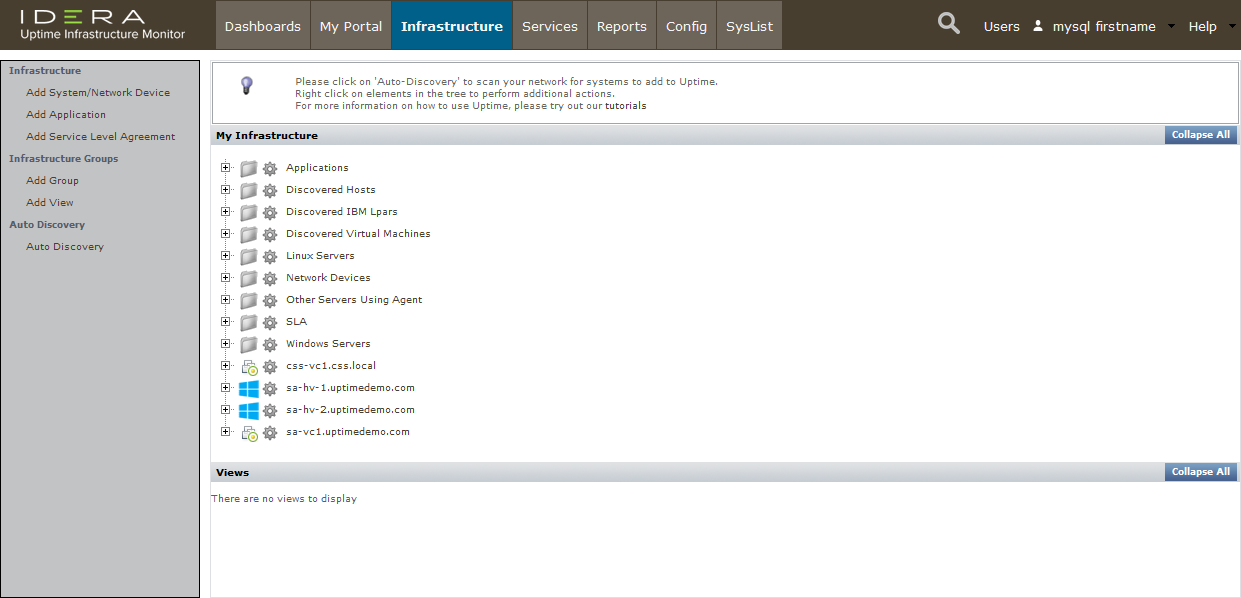
We are already familiar with My Infrastructure, where you manage your Elements by performing actions such as the following:
...
Uptime Infrastructure Monitor comes with a host of core dashboards. The following dashboard examples include the modest number of Elements you added to your monitored infrastructure in the previous module.
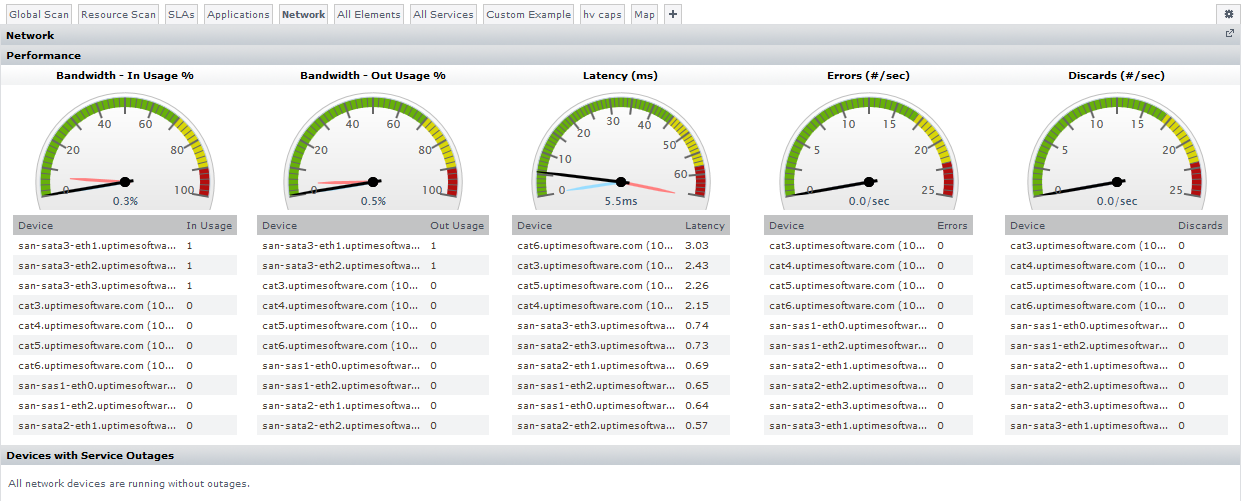
Network Dashboard
This Network dashboard summarizes the performance of monitored network devices. As you can see, we have but the single network device we added in the previous module:
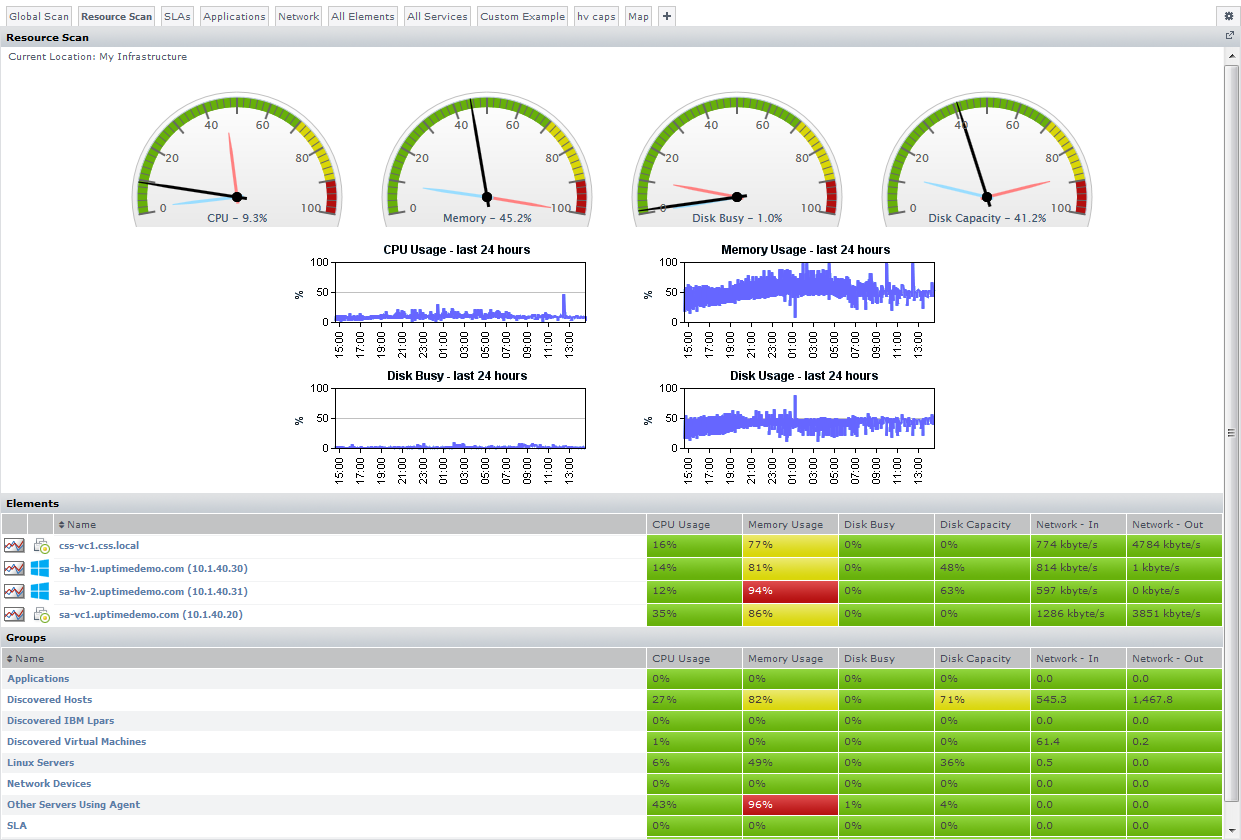
Resource Scan
This Resource Scan dashboard shows resource usage, useful in ensuring available capacity, for physical and virtual server-type Elements. Note the VMware vCenter Server Element you added in the previous module, along with its managed inventory of ESX hosts and virtual machines.
Global Scan
This Global Scan dashboard is a high-level status indicator of your entire infrastructure, showing resource usage and outages for all Elements. Your Elements are organized by groups, allowing you to click through down to individual Elements. This dashboard, along with Resource Scan, are good examples of how Element Groups and Views can help organize your monitored inventory for end-users.
...
Helpful end-user content with dashboards and reports depends on well-organized Elements, service monitors, and users (and more) behind the scenes. In the next module we'll focus on the My Infrastructure and Services panels, and learn more about organizing your monitored inventory.
...
| Section | ||||||||||
|---|---|---|---|---|---|---|---|---|---|---|
| ||||||||||
|