...
- In the Uptime Infrastructure Monitor Web interface, begin by clicking Config, then click Global Element Settings in the left pane.
On this page are configuration fields that let you define properties of different metric collection methods, allowing you to auto discover large groups that share the same properties. - In the Uptime Infrastructure Monitor Agent Global Configuration section, click Edit Configuration on the far right. The port used to communicate with is 9998. By default, SSL is not enabled.
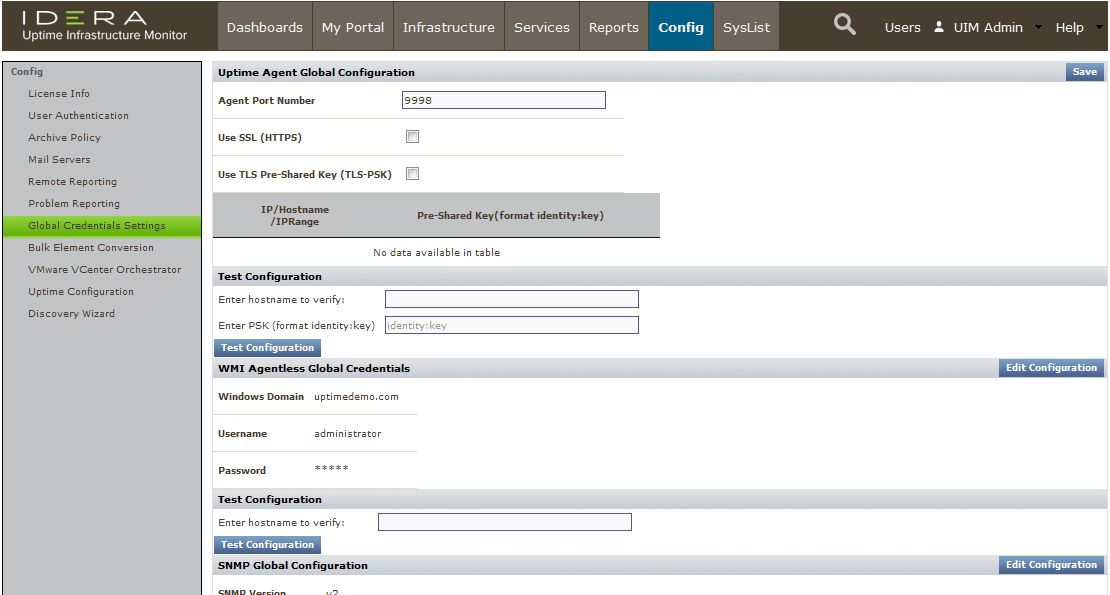
- Click Save.
Validation Step: Test the global setting by entering the hostname of the Linux server you installed the agent on during the previous exercise, and then clicking Test Configuration.
This Linux server is now ready to be added to Uptime Infrastructure Monitor as an agent-based Element. Before doing this, let's take a look at how enhanced metrics can similarly be collected for Windows-based servers.
...
| Section | ||||||||||
|---|---|---|---|---|---|---|---|---|---|---|
| ||||||||||
|