...
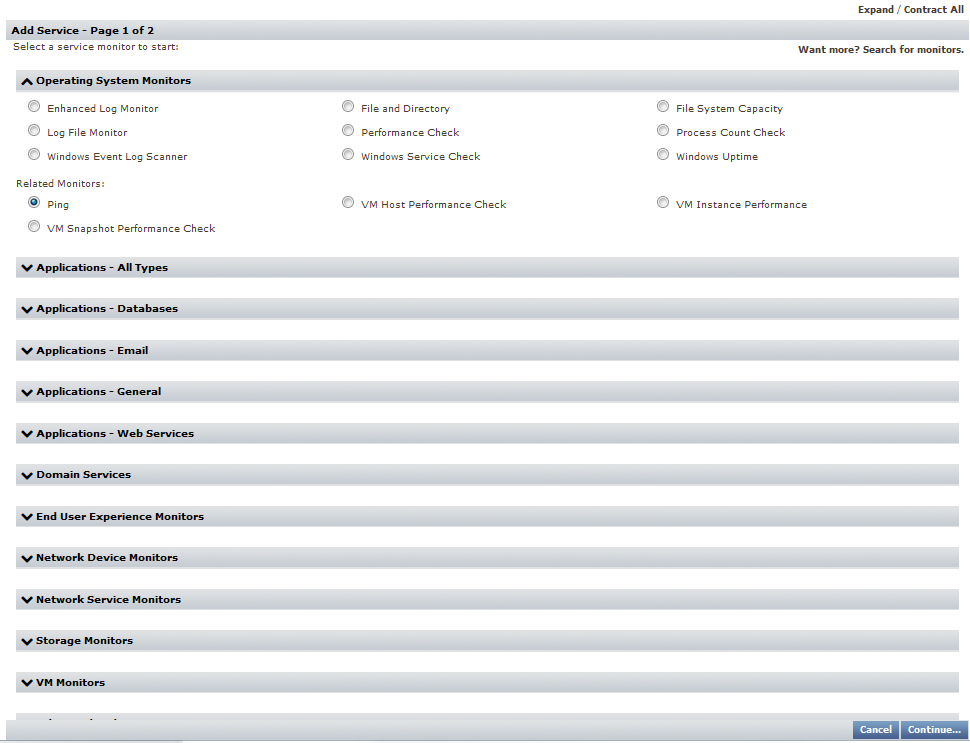
- Click Services, then click Add Service Monitor in the left pane.
- In the Add Service Monitor pop-up, select the Ping service monitor, and click Continue.
- Provide a Service Name of
pingTest, and make it Unassigned.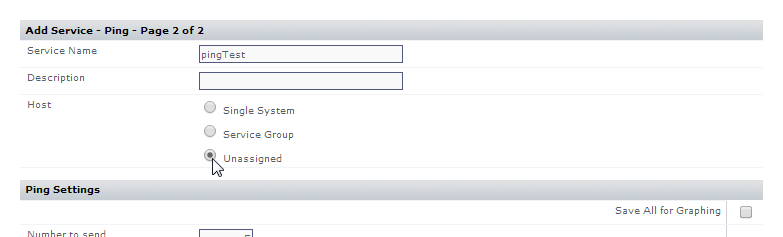
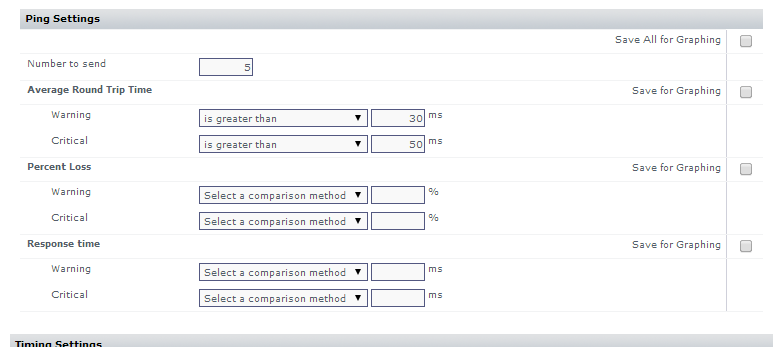
Note that While creating this service monitor, as it's being created, can also be assigned you also can assign it to an individual Element (that is, a single system), or a Service Group; let's leave it assigned to nothing for now. - For the sake of completion, let's configure a pair of alert thresholds for the service monitor's Average Round Trip Time:
- warning > 30 ms
- critical > 50 ms
- Click Finish, then click Close Window.
...
Click Dashboards, then click the Resource Scan tab. This dashboard summarizes resource usage for server-type Elements from various points in your hierarchy of Elements: you can click an individual server to show its usage data, or Element Groups to show an average of all its Elements. Your Production group is here, showing an average of the data for the servers you added to its platform-specific child groups. Click the parent group to drill down and display the Windows Servers and Linux Servers child groups. Each child group will now show shows usage data for its respective Element. Click either child group to display its contents, which in our case is a single server that you added:
...