...
Oracle Tablespace Check
The Oracle Tablespace Check monitors the size (as a percentage) of individual tablespaces within Oracle database instances. The Oracle Tablespace Check alerts you when a tablespace in your instance exceeds the defined thresholds.
Each database is logically divided into one or more tablespaces. One or more data files are explicitly created for each tablespace to physically store the data in a tablespace. The combined size of the data files in a tablespace is the total storage capacity of the tablespace. For example:
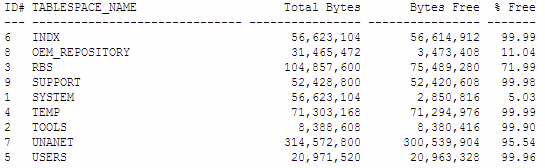
In the above table, the SYSTEM tablespace is over 95% full. If you set the Warning threshold to 90%, and the Critical threshold to 95%, the Oracle Tablespace Check returns a status of Critical.
| Info |
|---|
Use the Oracle (Basic Checks) monitor to determine the availability of Oracle databases, the performance of services, and the matched response of scripts. For more information, see Sybase. |
Configuring Oracle Tablespace Check Monitors
To configure Oracle Tablespace Check monitors, do the following:
- In the Oracle Tablespace Check monitor template, complete the monitor information fields.
To learn how to configure monitor information fields, see Monitor Identification. - Complete the following fields:
- Port
The number of the port on which the Oracle service is listening. The default is 1521 . - Username
The user name that is required to login to the Oracle database. - Password
The password that is required to login to the Oracle database. SID / Global Database Name
The Oracle System Identifier (SID) that identifies the Oracle instance. The SID defaults to this Oracle database, and typically matches the database name.
The SID is a unique name for an Oracle instance to switch between Oracle databases. The SID is It is included in the CONNECT DATA paths of the connect descriptors in the thetnsnames.orafile. As well, the SID is file, and in the definition of the TNS listener in the thelistener.orafile. file.Depending on your configuration, you may need to provide the full Global Database Name, which includes both the database name and database domain (for example, instead of
orcl, enterorcl.uptimesoftware.com).Noteinfo If you do not complete the Username, Password, and SID / Global Database Name fields, and up.time will attempt fails to connect to the database. If connection fails, the database returns a SQL exception error.
- Full Warning Threshold (Mandatory)
Enter a value that will change the status of the Oracle Tablespace Check from OK to Warning.
The warning threshold should be a percentage of the maximum file size, against which the monitor will check data files and log files. - Full Critical Threshold (Mandatory)
Enter a value that will change the status of the Oracle Tablespace Check from OK to Warning.
The critical threshold should be a percentage of the maximum file size, against which the monitor will check data files and log files. - Response Time
Enter the Warning and Critical Response Time thresholds for the length of time that a service check takes to complete. For more information, see Configuring Warning and Critical Thresholds.
- Port
- Click the Save for Graphing checkbox check box to save the data for a metric to the DataStore, which can be used to generate a report or graph.
- Complete the following settings:
- Timing Settings (see Adding Monitor Timing Settings Information for more information)
- Alert Settings (see Monitor Alert Settings for more information)
- Monitoring Period settings (see Monitor Timing Settings for more information)
- Alert Profile settings (see Alert Profiles for more information)
- Action Profile settings (see Action Profiles for more information)
- Click Finish.
SQL Server (Basic Checks)
The SQL Server (Basic Checks) monitor compares the performance of SQL Server databases and instances running on a system to the thresholds that you define. The SQL Server (Basic Checks) monitor does the following:
- determines whether or not SQL Server is running on your system
- checks whether or not SQL Server is listening on a specific port
- determines whether or not SQL Server can process queries
checks for values in base and computed tables
You can use regular expressions to identify a wide range of responses and to detect problems after they occur. You can also run scripts through up.time to alert you when a database component that is
being monitored is not performing as required.Info To configure this monitor, you should have a strong knowledge of regular expressions, Transact-SQL, and SQL Server.
Configuring SQL Server (Basic Checks) Monitors
To configure SQL Server monitors, do the following:
- In the SQL Server (Basic Checks) monitor template, complete the monitor information fields.
To learn about monitor information fields, see Monitor Identification. - Complete the following fields:
- SQL Server Port
The number of the port on which SQL Server is listening.
SQL Server uses Static Port Allocation or Dynamic Port Allocation ports. For more information, see the Knowledge Base article“SQL Server Ports.” - Port Check (Optional)
Select this option to open a socket connection that determines whether or not the database is listening on the defined port.
You should perform a port check because SQL Server can communicate statically on a defined or default port, or communicate dynamically on a port assigned by the operating system. - Username
The user name that is required to log into the SQL Server database. - Password
The password that is required to log into the SQL Server database. - Instance
The name of the SQL server instance to which you want to connect.
You can install multiple versions of Microsoft SQL Server on one computer. When installing a new version of SQL Server or maintaining an existing installation, you can specify it as:
- A default instance of SQL Server
This instance is identified by the network name of the computer on which it is running.
- A default instance of SQL Server
- A named instance of SQL Server
This instance is identified by the network name of the computer plus an instance name, in the format<computername>\<instancename>.
Most applications must use SQL Server client components to connect to a named instance. However, you can use tools such as the SQL Server Client Network Utility, or SQL Server Configuration Manager (depending on your SQL Server version) to configure a server alias name that the client components can use to connect to a named instance.
A computer can concurrently run any number of named instances of SQL Server. An instance name cannot exceed 16 characters.
- A named instance of SQL Server
- Database
The name of the SQL Server database that you want to monitor.
up.time views each database along the path/<system>/<instance>/<database>.
Each instance of SQL Server has four system databases –master,model,tempdb, andmsdb– and one or more user databases. Depending on their permissions, users can access some or all of the databases in an instance.
A connection to an instance is associated with a particular database on the server, called thecurrent database. You can switch from one database to another using the Transact-SQLUSE database_namestatement.
up.time gathers information from all of the databases in all instances on a system and aggregates this information in the metrics it returns to you. Unless you must identify a particular database on your system – for example, you have applied a name to the default instance – you should leave theDatabasefield blank. Script File
Click the Script File checkbox and then enter the full path on the Monitoring Station to the script that this monitor will run against the database.Info If you configured your database to allow logins with a user name and password, and you specify the script file but no login information, the script will fail and an error message will appear on the Global Scan dashboard. The script will run if you have configured your database to allow logins without a user name and password.
Script
Click the Script checkbox, then in the text box, type or copy the script that you want up.time to run against the database. Use this option if you do not have access to the file system on the Monitoring Station or if your script is short or will not regularly change.- Match
The value to match the script results against, which can be either a string or a regular expression. For more information, see Comparison Methods. For example, you can enter the following in the Match text box:^[OK]+
Where:-
^means start the match at the beginning of the line. -
[OK]is the pattern to match. -
+is the pattern to match anywhere on the line.
The value that your script returns can be a string that you can match to. If you match to the value you checked for, the status of the service monitor is OK. Otherwise, the status of the service monitor is Critical.
-
- Response Time
Enter the Warning and Critical Response Time thresholds. For more information, see Configuring Warning and Critical Thresholds.
- SQL Server Port
- Click the Save for Graphing checkbox to save the data for a metric to the DataStore, which can be used to generate a report or graph.
- Complete the following settings:
- Timing Settings (see Adding Monitor Timing Settings Information for more information)
- Alert Settings (see Monitor Alert Settings for more information)
- Monitoring Period settings (see Monitor Timing Settings for more information)
- Alert Profile settings (see Alert Profiles for more information)
- Action Profile settings (see Action Profiles for more information)
- Click Finish.
...