...
Working with Elements
Elements are the systems or network devices that you will monitor using up.time. You can add the following types of Elements:
| Element Type | Description | ||
|---|---|---|---|
| Agent | A system that has an up.time agent installed on it. | ||
| Net-SNMP v2 or Net-SNMP v3 | These are servers that use version 2 or 3 of the Net-SNMP protocol to monitor and manage systems in a TCP/IP-based network. Net-SNMP version 3 adds security features that are lacking in Net-SNMP version 2. All of the data gathered from Net-SNMP is based on the following MIB implementations:
| ||
| Network Device | An agentless, SNMP-based switch or router whose performance and configuration data is retrieved by focusing on specific OID values. | ||
| Novell NRM | A system that is running version 6.5 of Novell Remote Manager (NRM), a Web-based interface to newer Novell NetWare servers. Novell NRM saves server statistics in an XML file. up.time can retrieve the XML file, parse it, and then store the information in the DataStore. | ||
| pSeries LPAR Server (VIO) | A pSeries server that is hosting multiple logical partitions (LPARs). The VIO (virtual input/output) handles the physical I/O requests from the LPARs that are on the server. In this configuration, up.time directly polls the agents installed on the VIO and LPARs on a pSeries server for workload and other data. | ||
| pSeries LPAR Server (HMC) | A pSeries server that is hosting multiple LPARs, and is a managed server under the supervision of an HMC (Hardware Management Console). We recommend adding pSeries servers that are managed by an HMC using the Auto Discovery process. See Auto Discovery for HMC-Managed pSeries Servers for more information. | ||
| Virtual Node | An agentless device that up.time can communicate with using an IP address. | ||
| VMware ESX | A system that is running the VMware ESX server software, which enables a single host to run multiple virtual servers and their applications. ESX includes features like the ability to balance the computing loads of a group of virtual servers as well as backup data and better manage clusters. You do not need to install an agent on an ESX server.
| ||
| VMware vCenter Server | A central control point for a VMware vSphere datacenter that includes ESX hosts, VMs, as well as groupings such as clusters, datacenters, vApps, and resource pools. A VMware vCenter server's inventory, system configurations, storage profiles, and performance data can be represented in up.time alongside physical systems and network devices. When a VMware vCenter is added, its resources are detected and automatically imported. | ||
| WMI Agentless | A Windows-based system whose metrics collection is managed by WMI (Windows Management Instrumentation), and does not have an up.time Agent installed on it.
|
You can add multiple systems to up.time in a batch operation using a text file and a command line utility. See Adding Multiple Systems for more information.
Adding Systems or Network Devices
To add systems or network devices, do the following:
In the My Infrastructure panel, click Add System/Network Device.
- Enter a descriptive name for the server in the Display name in up.time field.
This name will appear in the up.time interface. A system can have a different display name than the hostname. For example, you can assign the display nameToronto Mail Serverto a system with the host name10.1.1.6. This way, IP addresses are stored in up.time, but a more descriptive or meaningful name is displayed in the up.time Web interface. - Optionally, enter a description of the system in the Description field.
- Select the Type of System/Device from the list:
- Agent
- Net-SNMP v2
- Net-SNMP v3
- Network Device
- Novell NRM
- pSeries LPAR Server (HMC)
- pSeries LPAR Server (VIO)
- Virtual Node
- VMware ESX
- VMware vCenter Server
- WMI Agentless (only present on Monitoring Stations running on Windows)
- Enter the host name of the system in the Host Name field.
The host name can be the actual name of the machine that up.time will be monitoring. You can also enter an IP address in this field. - Configure the system- or device-specific settings. The options depends on the system or device type you selected in step 4:
Agent
Configure the following:- Port
The port on which the up.time Agent is listening. - Use SSL
Select this check box if you want to securely communicate with the up.time Agent.
Info The up.time Agent’s information can be globally configured in the Global Element Settings page on the Config tab. If this has been done, and the Use up.time Agent Global Configuration check box is selected, the agent port and SSL options will not appear.
- Port
- Net-SNMP v2
Enter information in the following fields:- SNMP Port
The port on which the Net-SNMP instance is listening. - Read Community
A string that acts like a user ID or password, giving you access to the Net-SNMP instance.
Common read communities are public (enables you to retrieve read-only information from the device) and private (enables you to access all information on the device).
- SNMP Port
- Net-SNMP v3
Enter information in the following fields:- SNMP Port
The port on which the Net-SNMP instance is listening. - Username
The name that is required to connect to the Net-SNMP instance. - Authentication Password
The password that is required to connect to the Net-SNMP instance. - Authentication Method (optional)
From the list, select one of the following options, which will determine how encrypted information travelling between the Net-SNMP instance and up.time will be authenticated:- MD5: A widely-used method for creating digital signatures used to authenticate and verify the integrity of data.
- SHA: A secure method of creating digital signatures. SHA is considered the successor of MD5 and is widely used with network and Internet data transfer protocols.
- Privacy Password
The password that will be used to encrypt information travelling between the Net-SNMP instance and up.time. - Privacy Type (optional)
From the list, select one of the following options, that determine how information travelling between the Net-SNMP instance and up.time will be encrypted:- DES: An older method used to encrypt information.
- AES: The successor to DES, which is used with a variety of software that require encryption including SSL servers.
Info You can set both an authentication and password type, only one of them, or neither.
- SNMP Port
- Network Device (using version 2 of the SNMP protocol)
By default, the network device's SNMP Version is set to v2; complete the following fields:- SNMP Port
The port on which the network device is listening. - Read Community
A string that acts like a user ID or password, giving you access to the network device instance.
Common read communities are public (enabling you to retrieve read-only information from the device) and private (enabling you to access all information on the device). - Is Device Pingable?
This options specifies whether up.time can contact the network device using the ping utility.
There are scenarios in which you might not want the network device to be pingable (e.g., you have a firewall in place). Before selecting this check box, you should try to contact the network device using the ping utility. If you cannot ping it, ensure the check box is left cleared. Then, change the default host check for the network device. See Changing Host Checks for more information.
Info SNMP details can be globally configured in the Global Element Settings page on the Config tab. If these have been done, and the Use Global SNMP Connnection Configuration check box is selected, none of these options will appear, or need to be configured.
- SNMP Port
- Network Device (using version 3 of the SNMP protocol)
If your network device uses version 3 of the SNMP protocol, complete the following fields:- SNMP Version
Change this to v3 to reveal configuration options relevant to version 3 of the SNMP protocol. - SNMP Port
The port on which the network device is listening. - Username
The name that is required to connect to the network device. - Authentication Password
The password that is required to connect to the network device. - Authentication Method (optional)
From the list, select an option that will determine how encrypted information travelling between the network device and up.time will be authenticated:- MD5: A widely-used method for creating digital signatures used to authenticate and verify the integrity of data.
- SHA: A secure method of creating digital signatures. SHA is considered the successor of MD5 and is widely used with network and Internet data transfer protocols.
- Privacy Password
The password that will be used to encrypt information travelling between the network device and up.time. - Privacy Type (optional)
From the list, select an option that will determine how information travelling between the network device and up.time will be encrypted:- DES: An older method used to encrypt information.
- AES: The successor to DES, which is used with a variety of software that require encryption including SSL servers.
Info You can set both an authentication and password type, only one of them, or neither.
Is Node Pingable?
This option specifies whether up.time can contact the network device using the ping utility.
There are scenarios in which you might not want the network device to be pingable (e.g., you have a firewall in place). Before selecting this check box, you should try to contact the network device using the ping utility. If you cannot ping it, ensure the check box is left cleared. Then, change the default host check for the network device. See Changing Host Checks for more information.
Info SNMP details can be globally configured in the Global Element Settings page on the Config tab. If these have been done, and the Use Global SNMP Connnection Configuration check box is selected, none of these options will appear, or need to be configured.
- SNMP Version
- Novell NRM
Complete the following fields:- Port
The port on which the NRM is listening. By default, the non-SSL port is 8008, and when SSL is used, the port is 8009. - Use SSL
Select this check box if you want to securely communicate with the NRM. - Username
The user name that is required to access the Novell NRM Web interface. - Password
The password that is required to access the Novell Web interface.
- Port
pSeries LPAR Server (HMC)
If you are adding a pSeries server that is managed by a Hardware Management Console, complete the following fields:Info Although you can manually add HMC-managed pSeries servers, we recommend using the Auto Discovery process as this will add all the pSeries servers managed by the HMC, and automatically populate their respective managed server names. See Auto Discovery for HMC-Managed pSeries Servers for more information.
- HMC Host Name
The host name of the Hardware Management Console that is managing the pSeries server. Managed Server
The HMC's unique identifier for the pSeries server. This information can be retrieved from the HMC itself (e.g., by runninglssyscfg -r sys -F name).Info For HMC-managed pSeries servers, the above two fields are used in conjunction with the
Host Namefield. The pSeriesHost Nameand Managed Server name identify the p frame on the network, and within the HMC cluster, respectively. TheHMC Host Nameis required to identify the Hardware Management Console in order to retrieve some configuration and workload information about the pSeries server.- Username
The username required to log in to the HMC. - Password
The password used to access the HMC.
- HMC Host Name
- pSeries LPAR Server (VIO)
If you are adding a pSeries server that is not managed by an HMC, but instead communicates with the up.time Agent on a Virtual I/O server that's using IVM (Integrated Virtual Manager), configure the following:- Port
The port on which the up.time Agent is listening. - Use SSL
Select this check box if you want to securely communicate with the up.time Agent.
Info Information for the up.time Agent on the Virtual I/O server can be globally configured in the Global Element Settings page on the Config tab. If this has been done, and the Use up.time Agent Global Configuration check box is selected, the agent port and SSL options will not appear.
- Port
- VMware ESX
Complete the following fields:- Username
The user name required to log into the VMware ESX server. - Password
The password required to log into the VMware ESX server.
- Username
- VMware vCenter Server
Complete the following fields:- Web Services Port
The port that the VMware vCenter Web Service uses to communicate with up.time. - Username
The name of the VMware vCenter administrator account. - Password
The password for the VMware vCenter account. - In the vSync Settings - Virtual Machines section, indicate whether you would like up.time to Collect Virtual Machine data.
If you choose to ignore VMs in the VMware vCenter inventory by deselecting this check box, skip to the next configuration point; otherwise, configure how up.time's vSync will work with a vCenter's inventory of VMs.- Select the Collect up.time Agent data or Collect WMI Agentless data (if you are using data collection via WMI) to enable additional monitoring for VMs that are using the up.time Agent or WMI. (See Standalone Monitoring for vCenter VMs for more information.) If you have defined global Agent or WMI settings in the up.time Config panel, you can select the Use up.time Agent Global Configuration or Use WMI Global Configuration check box accordingly; otherwise, configure the appropriate fields:
- For the up.time Agent, indicate the Port on which it is listening, and whether it will Use SSL to communicate securely with up.time.
- For data collection via WMI, indicate the Window Domain on which WMI has been implemented, and the Username and Password required for access.
- Indicate whether up.time should Notify on newly discovered VMs, then select the desired Alert Profile and Action Profile.
If enabled, up.time can send notifications about, or perform scripted actions in response to, new VMs discovered in the VMware vCenter inventory during a vSync operation. (For more information, see Managing vSync.)
- Select the Collect up.time Agent data or Collect WMI Agentless data (if you are using data collection via WMI) to enable additional monitoring for VMs that are using the up.time Agent or WMI. (See Standalone Monitoring for vCenter VMs for more information.) If you have defined global Agent or WMI settings in the up.time Config panel, you can select the Use up.time Agent Global Configuration or Use WMI Global Configuration check box accordingly; otherwise, configure the appropriate fields:
- vSync Settings - vSphere ESX Hosts section, indicate whether up.time should Notify on new discovered hosts, then select the desired Alert Profile and Action Profile.
If enabled, up.time can send notifications about, or perform scripted actions in response to, new ESX hosts discovered in the VMware vCenter inventory during a vSync operation. (For more information, see Managing vSync.)
- Web Services Port
- WMI Agentless
Complete the following fields:- Windows Domain
The Windows domain in which WMI has been implemented. - Username
The name of the account with access to WMI on the Windows domain. Password
The password for the account with access to WMI on the windows domain.
Info WMI information can be globally configured in the Global Element Settings page on the Config tab. If these have been done, and the Use WMI Global Credentials check box is selected, none of these options will appear, or need to be configured.
- Windows Domain
- If you want to associate this system with a group, select the name of the group from the Group dropdown list.
See Working with Groups for more information on defining groups. - If you want to associate this system with a service group, select the name of the group from the Service Group dropdown list.
See Service Groups for more information. - Click Save.
A window listing general information about the system you have added appears. - If you want to add another system or network device, click Add Another. Then, repeat the previous steps in this section. Otherwise, click Close.
- Click Save.
Adding VMware Instances to up.time
| Info |
|---|
Ideally, VMware instance monitoring is performed by adding an entire VMware vCenter server and allowing up.time's auto-discovery process to add all of its inventory (including ESX servers and VMware instances). However, as a legacy option, you can manually add an ESX server to up.time's monitored inventory, and then manually add VMware instances. |
To add VMware instances to up.time from an ESX Server that was manually added as an up.time Element, do the following:
- In the My Infrastructure panel, click the name of the VMware server that contains instances that you want to monitor.
A new window containing information about the system appears. - Click the Info tab, and then click VMware Instances.
A list of VMware instances appears in the sub panel.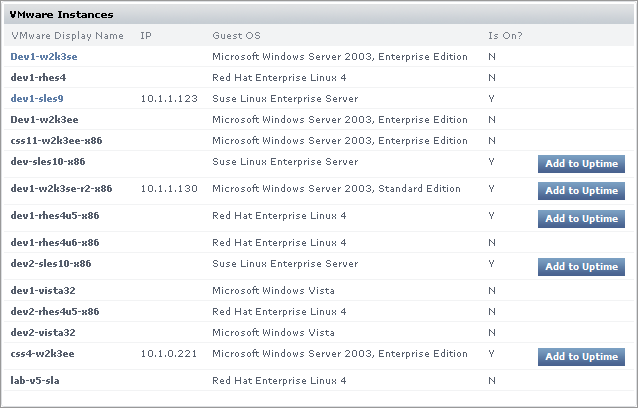
Click the Add to up.time button for the instance you wish to add.
The Add System window appears.Info The Add to up.time button will not be visible if the VMware instance is not powered on.
- If necessary, you can change any of the following options:
- Display name in up.time
- Description
- Group
- Service Group
- Click Save to add the instance to up.time.
SNMP-based Systems
Simple Network Management Protocol (SNMP) is a widely-used protocol that monitors the health of computer and network equipment. The SNMP Poller enables you to query SNMP devices or systems for a given object identifier (OID) of an SNMP Management Information Base (MIB). You can use the monitor to translate or clean up the returned response, then set thresholds for them.
SNMP works on the basis that network management systems send out a request, and managed devices send a response. SNMP messages consist of a header and a PDU (protocol data units). The headers consist of the SNMP version number and the community name; the community name is used as a form of security. Requests and responses between network management systems and devices is implemented using one of four operations: Get, GetNext, Set, and Trap.
- Get, GetNext, and Set (as well as the response PDU) consist of PDU type, Request ID, Error status, Error index and Object/variable fields
- Trap consists of Enterprise, Agent, Agent address, Generic trap type, Specific trap code, Timestamp and Object/Value fields
A MIB is a collection of hierarchically organized definitions, accessed using SNMP. All of the manageable features of all managed devices from different vendors are arranged in this tree. MIB definitions describe the properties of objects within a managed device, and OIDs uniquely identify managed objects in a MIB hierarchy.
Managed objects can exist in either scalar or tabular form. Scalar objects define a single object instance, identified by its “ .0 ”; tabular objects define multiple related object instances grouped in MIB tables, and is identified by its index value.
The MIB hierarchy can be depicted as a tree. Each vendor of SNMP equipment has an exclusive section of the MIB tree structure under their control. Vendors define private branches including managed objects for their own products. Each branch of the MIB tree has a number and name, and a point on the tree is named according to its complete path from the top of the tree (for example, .1.3.6.1.2.1.1.1.0 .). Nodes near the top of the tree are very general, whereas each ending node represents a particular feature on a specific device.
Net-SNMP
The up.time SNMP monitor also supports Net-SNMP, which is a suite of command line and graphical applications that do the following:
- request information from SNMP agents
- set information on SNMP agents
- generate and handle SNMP traps
To take advantage of the Net-SNMP features, you must:
- Install and configure the Net-SNMP application suite on your server. Visit http://net-snmp.sourceforge.net for more information:
- Have a Net-SNMP agent already installed on the host or hosts that you want to monitor. The Net-SNMP HOST-RESOURCES-MIB (used to gather performance statistics from a host) must also be enabled. See the Net-SNMP documentation for details.
- Add a Net-SNMP Element to up.time . For more information, see Adding Systems or Network Devices.
Supported Versions of SNMP
The up.time SNMP monitor works with the following versions of SNMP:
- v2
The second implementation of the SNMP protocol, which contains additional protocol operations as well as improved security and data authentication.
- v3
The latest implementation of the SNMP protocol, which adds security and privacy features that are missing in versions 1 and 2 of the protocol.
See SNMP Poller and Network Device Port Monitor for more information.
Adding Individual LPARs to up.time
After you have added pSeries servers - whether managed by an HMC or not - to up.time , you can add individual LPARs from those systems to up.time . While up.time collects workload data from all LPARs on a pSeries server (whether they have been added to up.time or not), adding LPARs can help you keep track of any specific LPAR.
To add an LPAR to up.time , do the following:
- In the My Infrastructure panel, click the name of the pSeries server that contains the LPAR that you want to monitor.
A new window containing information about the system appears. - Click the Info tab, and then click Logical Partitions .
A list of LPARs appears in the sub panel. - Click the Add to up.time button beside the LPAR that you want to add to up.time .
The Add System window appears. - If necessary, you can change any of the following options:
- Display name in up.time
- Description
- Group
- Service Group
- Click Save to add the LPAR to up.time .
| Info |
|---|
It can take up to 15 minutes for the Monitoring Station to retrieve enough samples to provide historical graphing data to the Monitoring Station. |
Agentless WMI Systems
If the Windows-based component of your infrastructure already makes use of WMI (Windows Management Instrumentation), Windows Elements can be configured to use it for data collection as an alternative to the up.time Agent. Using WMI allows you to avoid the overhead associated with managing and updating all of the systems on which an up.time Agent has been installed.
| Info |
|---|
WMI-based monitoring can only be performed if the Monitoring Station itself is running on Windows. |
An Element can be set to use WMI through the following methods:
- its system type is set to “WMI Agentless” when it is first added to up.time
- its system type was set to “Agent” when originally added to up.time , but is being individually modified to use WMI
- it is part of a bulk agent-to-WMI conversion with other agent-based Elements
Globally defined WMI credentials can be used for the second and third method. In the latter’s case, configuring these is mandatory. Refer to Configuring Global WMI Credentials for more information.
Regardless of which method is used, when changing a Windows Element’s data collection method, all historical data is retained.
WMI Requirements
In order to monitor agentless systems through WMI in a secure environment (e.g., through a firewall), you need to create an exception for WMI on the host end. Consult the Microsoft documentation or developer resources for information on connecting to WMI on a remote computer.
Adding a WMI System to up.time
To add an agentless WMI system to up.time , do the following:
- On the up.time tool bar, click My Infrastructure , then click Add System/Network Device .
- Complete the Display name in up.time and Description fields.
See Adding Systems or Network Devices for more information. - Select WMI Agentless from the Type of System/Device dropdown list.
- In the Host Name field, enter the actual name or IP address of the machine that up.time will be monitoring.
- Select the Use WMI Global Credentials check box if they have been configured, and you would like to use them (see Configuring Global WMI Credentials for more information); otherwise complete the following fields:
- Windows Domain
The Windows domain in which WMI has been implemented. - Username
The name of the account with access to WMI on the Windows domain. - Password
The password for the account with access to WMI on the windows domain.
- Windows Domain
- If you want to associate this system with a group, select its name from the Group dropdown list.
- If you want to associate this system with a Service Group, select its name Service Group dropdown list.
- Click Save .
Switching an Element to WMI Data Collection
To change the data collection source for an individual Windows Element from the up.time Agent to WMI, do the following:
- On the Global Scan dashboard or My Infrastructure panels, click the name of the Windows server.
- Click the Info tab, then click Info & Rescan.
- Click the Edit Collection Method link found beside the Collection Method setting.
The Edit Data Collection Method window appears. - Select the WMI Agentless data collection option.
- Select the Use WMI Global Credentials check box if they have been configured, and you would like to use them (see Configuring Global WMI Credentials for more information); otherwise complete the following fields:
- Windows Domain
The Windows domain in which WMI has been implemented. - Username
The name of the account with access to WMI on the Windows domain. - Password
The password for the account with access to WMI on the windows domain.
- Windows Domain
- Click Save to retain your changes and close the pop-up window.
Switching an Element to Agent-Based Data Collection
To change the data collection source for an individual Windows Element from WMI to the up.time Agent, do the following:
- On the Global Scan dashboard or My Infrastructure panels, click the name of the Windows server.
- Click the Info tab, then click Info & Rescan.
- Click the Edit Collection Method link found beside the Collection Method setting, as shown below
The Edit Data Collection Method window appears. - Select the up.time Agent data collection option.
- Select the Use up.time Agent Global Configuration check box if it has been configured, and you would like to use it (see Configuring a Global up.time Agent Configuration for more information); otherwise complete the following options:
- Port
The port through which the up.time Agents communicate with the up.time Monitoring Station. - Use SSL
Select this check box if the agent securely communicates with the Monitoring Station using SSL.
- Port
- Click Save to retain your changes and close the pop-up window.
Converting Multiple Elements to WMI Data Collection
To change multiple agent-based Elements to use WMI for data collection, do the following
- Ensure the global settings for WMI credentials have been set (see Configuring Global WMI Credentials for more information).
- On the up.time tool bar, click Config .
- In the tree panel, click Bulk Element Conversion .
- In the Windows Agent Elements section, select the check boxes that correspond to the agent-based Elements whose data collection method is to be changed to WMI.
- Click Convert to WMI.
When the conversion is complete, the lists of agent-based and WMI Elements will be refreshed to reflect the changes.
Converting Multiple Elements to Agent-Based Data Collection
To change multiple WMI Elements to use the up.time Agent for data collection, do the following
- Ensure a global up.time Agent configuration exists (see Configuring Global WMI Credentialsa Global up.time Agent Configuration for more information).
- On the up.time tool bar, click Config .
- In the tree panel, click Bulk Element Conversion .
- In the WMI Elements section, select the check boxes that correspond to the WMI Elements whose data collection method is to be changed to the up.time Agent.
- Click Convert to Agent.
When the conversion is complete, the lists of agent-based and WMI Elements will be refreshed to reflect the changes.
| Info |
|---|
For bulk WMI-to-agent conversions, the port used by all of the converted up.time Agents must match the port specified in the global agent configuration. |
Novell NRM Systems
up.time collects performance metrics and availability information from version 6.5 of the Novell Remote Manager (NRM) using HTTP or HTTPS. up.time extracts performance information from the NRM by reading and parsing XML files.
Adding a Novell NRM System to up.time
To add a Novell NRM version 6.5 system to up.time , do the following:
- On the up.time tool bar, click My Infrastructure and then click the Add System/Network Device tab.
- Complete the Display name in up.time and Description fields.
See Adding Systems or Network Devices. for more information. - Select Novell NRM from the Type of System/Device dropdown list.
- Complete the following fields:
- Host name
The actual name of the machine that up.time will be monitoring, or the IP address of the machine. - Port
The port on which the NRM is listening. The default is 8008 for a port that is not using SSL. The default for a port that is using SSL is 8009 . - Username
The NRM administrator account name. This field is mandatory. Password
The NRM administrator password. This field is mandatory.Info The password is encrypted and stored in the up.time DataStore.
- Host name
- If you want to associate this system with a group, select its name from the Group dropdown list.
- If you want to associate this system with a Service Group, select its name Service Group dropdown list.
- Click Save .
NRM Statistics Captured by up.time
up.time captures the following Novell NRM system (version 6.5) statistics:
Each statistic returns one of the following statuses:
- Good
The statistic is well within the threshold suspect value.
- Suspect
The statistic is between the threshold good and critical values.
- Bad
The statistic is greater than the threshold critical value.
Work To Do Response Time
This statistic enables you to view how processes share the CPU. The response time is the amount of time that a Work To Do process requires to run.
If this statistic returns a value of Suspect, you can check the running threads to determine why there is a delay in the Work To Do threads. If the value is Bad, thread is probably running more than it should or it is hung. You should identify the parent NetWare Loadable Module and then unload and reload it if possible.
Allocated Service Processes
This statistic enables you to view, as a graph, how the service processes are allocated on your server.
If the service processes are approaching the maximum, increase the value of the Maximum Server Processes Set parameter. If you have only a few available server processes, increase the Minimum Server Processes Set parameter.
If the status is Bad, examine your server by doing the following:
In Novell NRM, click Profiling / Debugging .
- Check the information for server process functions.
- Change the Maximum Server Processes and the Minimum Server Process Set parameters.
Available Server Processes
This statistic enables you to view the number of available processes on your server as a graph. The graph charts the processes that are available every five seconds over a 50 second period.
If the status is Suspect or Bad, you should increase the Set parameters for Maximum Server Processes and the Minimum Server Processes settings. If the number of available server processes has not reached the maximum and is not increasing, you should add memory to your server.
Abended Thread Count
This statistic enables you to view the threads that have ended abnormally (abended) and are suspended. This statistic returns the following statuses:
If the status is Suspect or a Bad, your server has abended and has recovered automatically by suspending the offending thread while leaving the rest of the server processes running. As a result, some of the server's functions were compromised. You must determine which module, driver, or hardware the abended threads belong to, and then take the appropriate action.
CPU Utilization
This statistic enables you view, as a graph, how busy any given CPU is. up.time tracks usage on a per CPU basis, collecting data every 30 seconds. The graph displays a 10 second history.
If the status is Suspect or Bad, determine which thread or module is causing the most CPU cycles and take appropriate action, including the following:
- unloading and reloading the module
- reporting problems to the vendor of the module
- loading an updated module
To determine which thread or module is using the most CPU cycles, do the following:
- In Novell NRM, click Profile / Debug .
- Do one of the following:
- View the Execution Profile Data by Thread data.
- Click Profile CPU Execution by NLM .
Connection Usage
up.time monitors connections on a per-server basis. NRM displays only the following metrics:
- the number of connections that are being used
- the peak number of connections used on this server
Available Memory
This statistic enables you to view the amount of memory that is not allocated to any service. Most, if not all, of this memory is used by the file system cache. When available memory gets too low, modules might not be able to load or file system access might become sluggish.
DS Thread Usage
This statistic enables you view the number of server threads that Novell eDirectory uses. The server thread limit ensures that threads are available for other functions as needed - for example, when large number of users log in at the same time.
eDirectory uses multiple server threads. However, its thread requirements should not cause poor performance because eDirectory cannot use more than its allocated maximum number of threads.
If this statistic returns a Good status, eDirectory is using less than 25% of the available server threads. If it returns a Suspect status, eDirectory is using between 25% and 50% of the available server threads. If the status is Bad, eDirectory is using more than 50% of the available server threads.
Packet Receive Buffers
This statistic enables you to view the status of Packet Receive Buffers for the server. Packet Receive Buffers transmit and receive packets. You can set the maximum or minimum number of buffers to allocate using the Maximum Packet Receive Buffers or Minimum Packet Receive Buffers SET parameters. The minimum number of buffers is the number of packets that are allocated at when the system is initialized.
If the number of Packet Receive Buffers is increasing, the system will be sluggish. If the number of Packet Receive Buffers reaches the maximum, and no Event Control Blocks (ECBs) are available, the server will become very sluggish and will not recover.
Available Event Control Blocks (ECBs)
This statistic enables you to view the status of available Event Control Blocks (ECBs). Available ECBs are Packet Receive Buffers that have been created but which are not currently being used.
If the available ECB count is zero, the server will become sluggish until enough ECBs are created to fill the demand. The server will recover as long as the number of Packet Receive Buffers does not increase to the maximum that can be allocated.
LAN Traffic
This statistic shows whether or not your server can transmit and receive packets. If this statistic returns a Good status, the server is able to accept or transmit packets through the network board. If the status is Bad, the network board is not transmitting or receiving packets.
All servers should be able to transmit or receive packets. If your server is not transmitting, your LAN is not functioning properly. Check the drivers and protocol bindings for the network board on the server. If the drivers and protocol bindings are functioning properly, then the network board is probably faulty. If the network board is functioning, you should perform a diagnostic on your LAN.
Available Disk Space
This statistic enables you to view the status of the available disk space on all mounted volumes on a server. This statistic returns the following statuses:
Disk Throughput
This statistic enables you to view the status of amount of the data that is being read from and written to the storage media on this server.
If this statistic returns a Good status, then the storage system is experiencing reads or writes, and there are no pending disk I/Os. If the status is Suspect, the storage system has disk I/Os pending, no reads or writes have occurred, and less than four samples have been taken. If the status is Bad, the storage system has disk I/Os pending, no reads or writes have occurred, and four or more samples have been taken.
Adding Multiple Systems
It can be time consuming to add large numbers of systems and network devices to up.time individually through the Web interface. You can, however, add multiple systems to up.time using a text file and the addsystem command line tool.
A text-based "hosts file" can contain entries that mirror the fields in up.time's Add System window; these fields provide profile and connection information about the system or network device. The hosts file format is as follows:
- A series of name-value pairs. Each name-value pair is separated by a colon, and is on a separate line.
- The information for each host is separated by a pair of percentage signs (
%%), and is also on its own separate line.
Hosts File Name-Value Pairs
The following table explains the properties you can include in a hosts file to describe Elements. The properties required to add a system or network device depends on the type of Element it will be. For example, to add an Agent-based system, you only need to provide information for Host Name, Type, and Port. (For more information, see Working with Elements for a summary of Element types, and Adding Systems or Network Devices for configuration information by Element type.)
Element Property | Description | Required / Optional |
|---|---|---|
| The name or IP address of the Element (i.e., system or network device) that you are adding to up.time. | required |
| The Element name as it will appear in the up.time Web interface. There are some views, such as My Infrastructure, that will show the host name alongside the display name. | required, but can be identical to the Host Name value |
| A short description of the Element. This field is optional. | optional |
| The type of Element, which can be one of the following:
| required |
| The name of the up.time service group to which you want to add the Element. Service groups allow you to group multiple service monitors and simultaneously apply them to multiple Elements. (See Service Groups for more information.) | optional |
| The port on which up.time will connect to the Element. When a port is required, up.time uses a default whose value depends on the type of Element (e.g., network devices will default to an SNMP port of 161). | required for these Element types:
|
| If the Element is a network device or a server using version 2 of the Net-SNMP protocol, you will need to specify the read community, which acts like a user ID or password, in order to access the system or device. Use one of the following options:
| required for network devices or servers using version 2 of the Net-SNMP protocol |
| The name or IP address of the Hardware Management Console (HMC) that is being used to manage one or more pSeries servers in your infrastructure. For pSeries servers, this field is used in conjunction with the | required for pSeries servers managed by an HMC |
| The unique identifier for a pSeries server that is managed by an HMC. This managed server name can be retrieved from the HMC itself (e.g., by running For pSeries servers, this field is used in conjunction with the | required for pSeries servers managed by an HMC |
| The username required to access the Element. | required for the following Element types:
|
| The password required to access the Element. | required for the following Element types:
|
| The name of the up.time infrastructure group to which you want to add the Element. Infrastructure groups help you organize all of your monitored systems and network devices. (See Working with Groups for more information.) | optional |
| For some types of servers, you can specify whether up.time will securely communicate with an installed Agent using SSL. Valid options are | optional for the following Element types:
|
| If the Element is a network device or server using version 3 of the Net-SNMP protocol, you will need to specify an authentication method to determine how encrypted information travelling between the Net-SNMP instance and up.time will be authenticated. Use one of the following options:
| required for network devices or servers using version 3 of the Net-SNMP protocol |
| If the Element is a network device or server using version 3 of the Net-SNMP protocol, you will need to specify the password that will be used to encrypt information travelling between the Net-SNMP instance and up.time. | required for network devices or servers using version 3 of the Net-SNMP protocol |
| If the Element is a network device or server using version 3 of the Net-SNMP protocol, you will need to specify how information travelling between up.time and the Net-SNMP instance is encrypted. Use one of the following options:
| required for network devices or servers using version 3 of the Net-SNMP protocol |
| For network devices and nodes, use this field to specify whether or not up.time can contact it using the ping utility. Valid options are | optional for network devices and nodes |
| For Windows-based Elements using WMI for data collection, the Windows domain in which WMI has been implemented. | required for WMI Agentless |
| For Windows-based Elements using WMI for data collection, the name of the account with access to WMI on the Windows domain. | required for WMI Agentless |
| For Windows-based Elements using WMI for data collection, the password for the account with access to WMI on the windows domain. | required for WMI Agentless |
Examples of Hosts File Entries
The following table contains sample host file entries for different Element types that you can add to up.time:
| Host Type | Sample Hosts File Entry |
|---|---|
|
|
|
|
|
|
|
|
|
|
|
|
|
|
Creating a Hosts File
The simplest way to create a hosts file is to use a text editor to type the entries in a file.
If you have a large number of systems to add, you can keep a list of all systems and network devices in a spreadsheet. You can then save the list as a text file or a comma-separated values file, then use a script to manipulate these files into the proper format.
Adding Multiple Systems to up.time
To add multiple systems to up.time, do the following:
- Copy the hosts file to the directory in which you installed the up.time Monitoring Station.
- At the command line, navigate to the
scriptsfolder.
For example, if you installed the Monitoring Station in the default location on a Windows system, navigate to the following folder:
C:\Program Files\uptime software\uptime\scripts\ - Enter the following command:
addsystem <path_and_filename>
Where<path_and_filename>is the name of, and full path to, the text file that contains the list of systems that you want to add to up.time.
The systems listed in the file are added to up.time, unless one of the following occurs:- up.time cannot connect to the system
- the system does not exist in your environment
- the system has already been added to up.time
Info If you have deployed up.time UI instances, ensure you always run command-line scripts such as
addsystemon the primary Monitoring Station that is actually performing data collection.
Editing a System Profile
After you have added a system to up.time , you might need to change some of the basic information about that system. You can do this by editing the system profile.
To edit a system profile, do the following:
- In the My Infrastructure panel, click the gear icon beside the Element whose profile you want to modify, then click Edit.
The Edit System window appears. - In the Edit System window, change any or all of the following options:
- Display name in up.time
The descriptive name for the system that appears in the up.time Web interface. - Description
A brief functional description of the system. - Parent Group
Select the group of systems in up.time with which this system will be associated. - Custom Field 1 to Custom Field 4
These fields enable you to include additional information about the system. For example, you can record the types of reports that should be run on this system, or when maintenance is scheduled.
The information in the Custom Fields is displayed when you view system information by clicking the Info & ReScan link in the Tree panel. - Number of processes to retrieve
The default number of processes running on the system that up.time will retrieve. If you select 10 processes, and there are 20 running on the system, up.time retrieves the 10 busiest processes. - Is monitored?
Click this checkbox to turn monitoring off for this system. If monitoring is turned off, the system will not appear on the Global Scan dashboard.
- Display name in up.time
- Click Save.
...