...
- In the up.time Web interface, begin by clicking My Infrastructure.
- Begin adding your VMware vCenter Server as an up.time Element. In the My Infrastructure view, click Add System/Network Device.
- In the Add System window, select VMware vCenter Server from the Type of System/Device drop-down. This reveals configuration fields specific to this type of monitored Element.
- Complete the fields similar to those below:
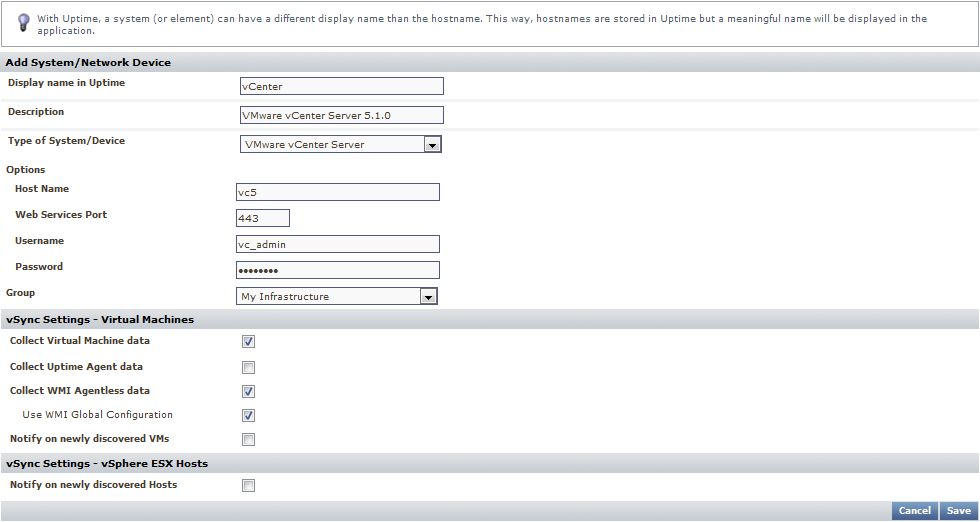
- The Display Name is used throughout the up.time interface, as well as reports.
- The Description can contain any extra information such as the version number or IP address.
- The Options fields tell up.time how to find and access your vCenter Server.
- You can leave the vSync Settings options at their defaults.
Note title Stick to the Basics By default, the Collect up.time Agent data and Collect WMI Agentless data check boxes are clear. This means the metrics up.time retrieves for each monitored VM is what the vCenter Server itself collects and provides to up.time. For these "basic VMs", their metrics are a subset of what can be collected from the guest operating system using the up.time agent or using WMI. For simplicity in this guide, we will work with a "basic" vCenter Server inventory. You can learn more about agent- and WMI-based data collection in the next module, where you are adding physical servers.
- Click Save. up.time will search for your vCenter Server and import its inventory of ESX hosts and VMs as up.time Elements. This can take a minute or more, depending on how large your vCenter inventory is.
- up.time will inform you when the vCenter Server has been added:
Click Done to close the Add System window.
...
After adding the vCenter Server and closing the Add System window in the previous section, the main UI window is displaying the My Infrastructure view:
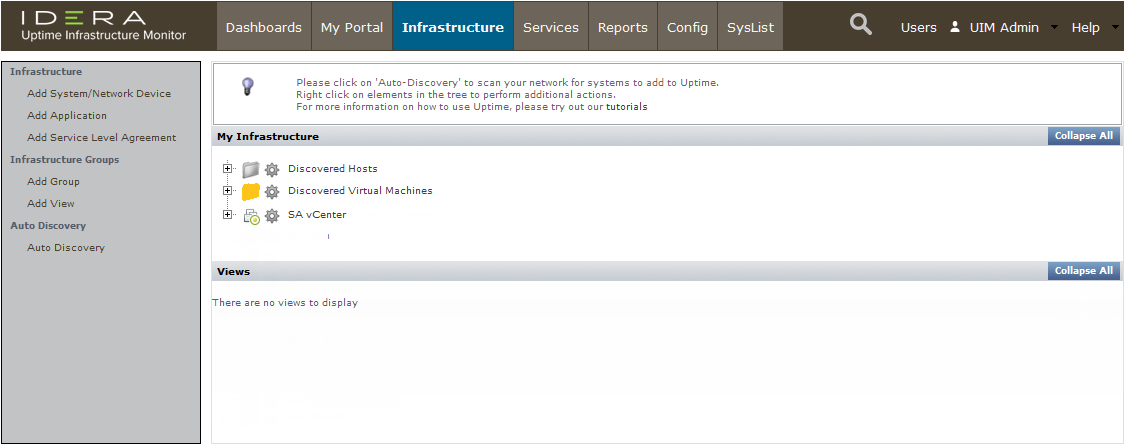
If you look at your up.time inventory, you can see that part of the vCenter Server import process included the automatic creation of two top-level Element Groups (which are folders and subfolders used to organize up.time Elements): Discovered Hosts and Discovered Virtual Machines. These Element Groups respectively include the ESX hosts and virtual machines managed by the vCenter Server, and these contents can be further rearranged in up.time, for example, by platform or server function.
...
Consider this example vCenter, which includes a datacenter:
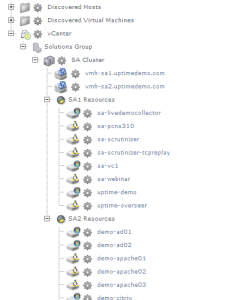
In the above example, the datacenter's cluster of ESX hosts is organized into two resource pools, along with their component virtual machines. Hosts and virtual machines can be moved elsewhere in My Infrastructure, but the hierarchy remains intact as a reflection of the vCenter Server:
...
- Click My Infrastructure.
- Click the vCenter Server's gear icon, then in the pop-up menu, click Graph Performance. Whenever you take this action with an Element, you are taken to its Quick Snapshot.
Whenever you graph the performance of an Element from the My Infrastructure view, its Quick Snapshot is displayed. What exactly is shown depends on the type of Element, which we will see throughout this part of the Getting Started Guide. In this case, the vCenter Server's Quick Snapshot shows datacenter-level information that is directly pulled from the vCenter Server metrics: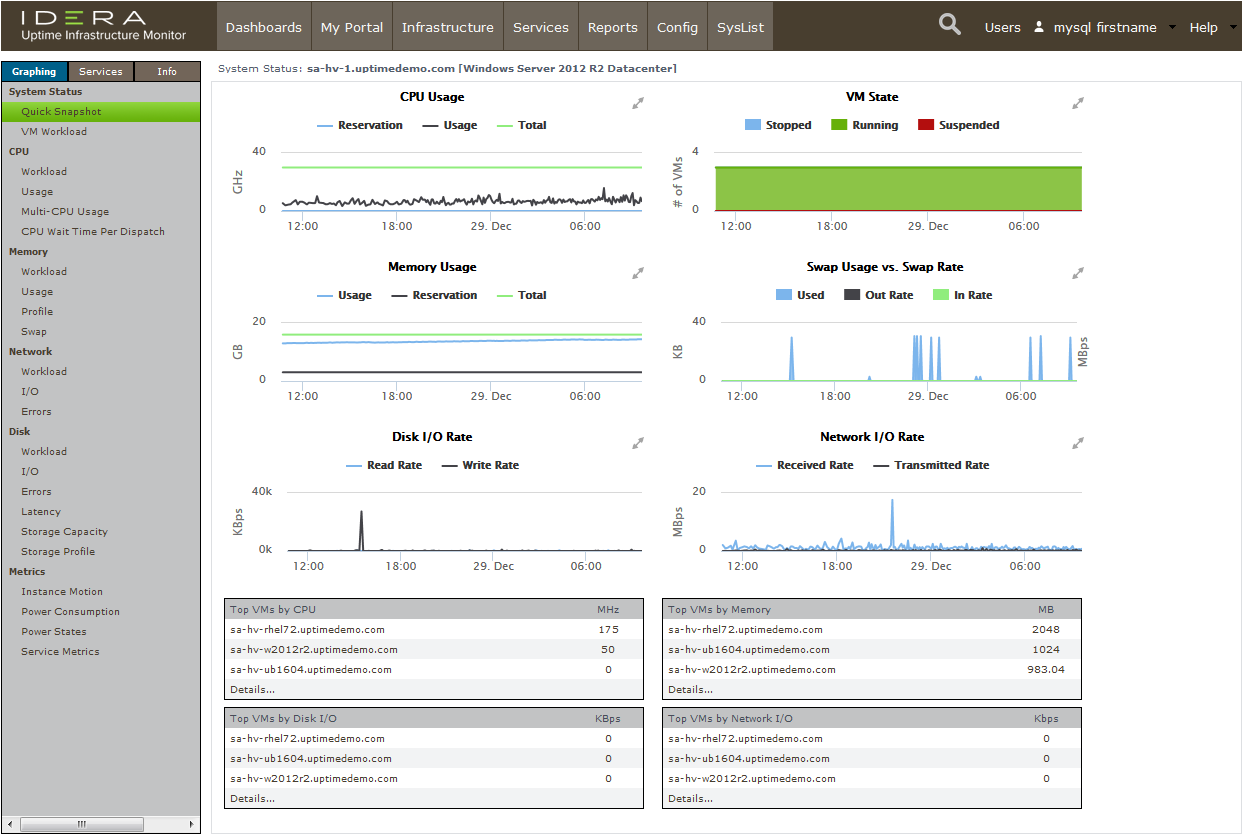
You can incorporate these basic metrics into your up.time monitoring plans (such as alerts or reporting). It's more likely, however, that your interest will be with the virtual machines that are a part of the vCenter Server inventory. - Click My Infrastructure to return to the main inventory view.
- Expand the Discovered Virtual Machines Infrastructure Group, and click the gear icon for any of the VMs. In the pop-up menu, again, click Graph Performance to display that Element's Quick Snapshot. This displays metrics for the VM that have been pulled from the vCenter Server's metrics:
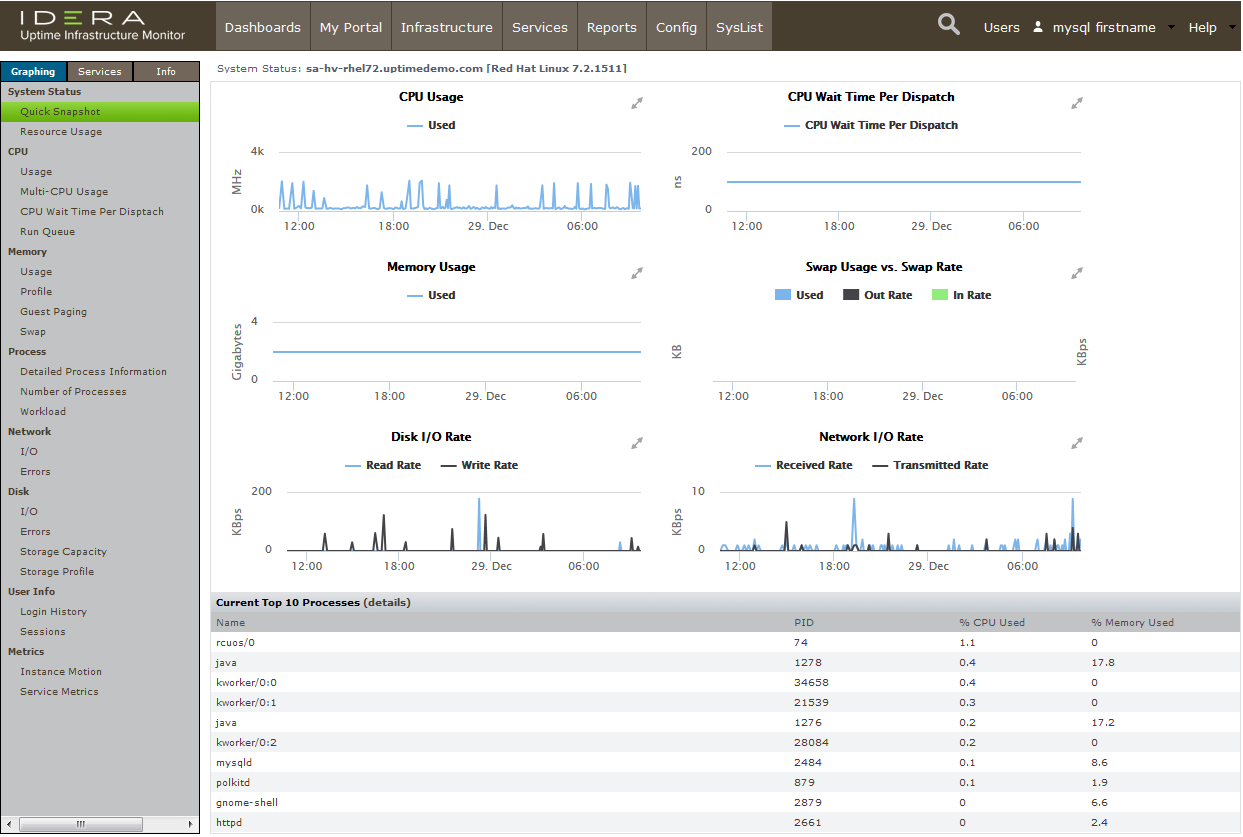
As with the vCenter Server Element's metrics, you can incorporate these into your alerts and reports. However, this "basic VM" view allows you to work only with what the vCenter Server provides; there may be cases where you want to add a little extra "up.time power," and install an up.time agent on the VM. This is something you will learn a bit more about in the next module.
...