...
The Report Log
The Report Log tracks the progress and status of scheduled reports, or reports that are running in the background. Using the Report Log, you can quickly determine whether reports are successfully generated. If they have not, then you can use the log to determine why report generation failed.
The Report Log subpanel tracks the status of reports in the following sections:
Pending Reports
Reports that are in the report queue, and are waiting to run. This section contains the following information:
- the name of the report
- the description of the report, if available
- whether the report is scheduled
- the date and time on which the report is run
Running Reports
Reports that are running. This section contains the same information as the Pending Reports section.
If the running report is not a scheduled report, Emailing report in PDF format appears in the Report Name column.
Completed Reports
Reports that have finished running, whether they were successfully generated or not. This section contains the following information:
- the name of the report
- the date and time on which the report run was started
- the date and time on which the report run ended
- the status of the report - for example, finished
- a status message - for example, Email sent or Address list is empty
Viewing Report Logs
To view report logs, do the following:
- On the Uptime Infrastructure Monitor tool bar, click Reports.
- In the Tree panel, click Report Log.
The report log appears in the Reports subpanel.
If there are no reports in the queue, Uptime Infrastructure Monitor displays a message similar to the following ones in the Pending Reports and Running Reports sections of the Report Logs subpanel:
No reports are pending
No reports are running
Deleting Report Log Entries
Completed reports are stored in a table in the Uptime Infrastructure Monitor DataStore. To free space in the DataStore, or to remove report log entries that you no longer need, you can delete entries in the report log from the Report Log subpanel.
To delete entries in the Report Log, do one of the following:
- Click the Delete icon beside the entry that you want to delete.
- If you want to delete all entries in the Report Log, click the Remove Completed Reports button.
When prompted to confirm whether you want to delete the report log entry, click OK .
Remote Reporting Instances
A reporting instance is a transparent, license-free, Uptime Infrastructure Monitor installation that is dedicated to generating and serving reports. If you offload all report-related tasks to a second instance, you can significantly reduce core load on your Monitoring Station.
If you are managing a large Uptime Infrastructure Monitor deployment, you can consider implementing a reporting instance if many systems are included in your reports. Requirements vary and depend on several factors, but as a general rule, a reporting instance may be appropriate if you have over 500 systems and regularly run reports with a month or more of data. Contact customer support for help on assessing your environment.Reporting Instance Architecture
When a deployment includes a reporting instance, the two Uptime Infrastructure Monitor installations respectively perform the following functions:
- the Monitoring Station handles all monitoring, administration, data archiving and report scheduling tasks
- the reporting instance generates, stores, and distributes reports
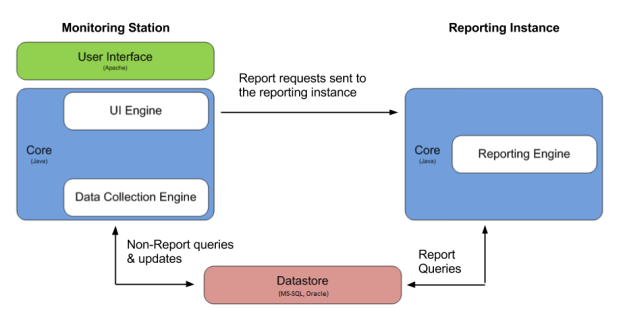
In this deployment configuration, the Monitoring Station is still the main point of interaction for all Uptime Infrastructure Monitor users; no one can log in to the reporting instance Web interface. When the Monitoring Station receives a report generation request or is scheduled to generate one, it seamlessly offloads the request to the reporting instance. Generated reports are stored on the reporting instance, which by default are the following:
/GUI/reportcachefor instantly generated reports/GUI/publishedfor scheduled reports
All report-related configuration settings (whether reportCacheExpiryDays in the Uptime Infrastructure Monitor Configuration panel, the Mail Server settings on the Config tab, or publishedReportRoot or reporting.prefetch.images.threads in uptime.conf) are modified on the Monitoring Station.
Creating and Configuring a Reporting Instance
Before installing the reporting instance, ensure the following:
- the existing Monitoring Station is running and collecting data
- the host where the reporting instance is installed meets the minimum Monitoring Station requirements
- the version of Uptime Infrastructure Monitor that you want to install on the reporting instance is the same as the Monitoring Station (note that the two hosts' operating systems can be different)
Installing and Configuring Uptime Infrastructure Monitor as a Reporting Instance
To set up a second Uptime Infrastructure Monitor instance as a reporting instance, do the following:
Install and configure the reporting instance:
- Install Uptime Infrastructure Monitor on the new host.
Refer to directions for your target platform in Installing the Monitoring Station; you can ignore the Post-Installation Tasks section. - Begin editing the reporting instance's
uptime.conffile, which is found at the root of the Uptime Infrastructure Monitor installation. - Add the following line:
reportingInstance=true
Enabling this parameter effectively disables all non-reporting functions for this Uptime Infrastructure Monitor instance. Its report-related options, including the SMTP settings to distribute reports, is set on the Monitoring Station. - Reduce the connection pool size:
connectionPoolMaximum=50 Configure the database settings so that the reporting instance connects to the same database your Monitoring Station is using:
Code Block title MySQL dbDriver=com.mysql.jdbc.Driver dbType=mysql dbHostname=reportingInstanceHostname dbPort=3308 dbName=uptime dbUsername=uptime dbPassword=uptime dbJdbcProperties=
Code Block title SQL Server dbDriver=net.sourceforge.jtds.jdbc.Driver dbType=mssql dbHostname=10.1.1.124 dbPort=1433 dbName=uptime dbUsername=uptime dbPassword=password
Code Block title Oracle dbDriver=oracle.jdbc.OracleDriver dbType=oracle dbHostname=oraserv dbPort=1521 dbName=uptime dbUsername=uptime dbPassword=password
Ensure the other database platform's configuration lines are commented out with the # character.
Ensure database access from the reporting instance:
Adding a reporting instance requires you to change your database to allow a user to connect to it from an external host. The following steps are for the MySQL database bundled with the Monitoring Station. If you are using Oracle or SQL Server as the DataStore, contact your database administrator to ensure that database can be accessed from the reporting instance.
- At the command line on the Monitoring Station, go to the
<uptime>/mysql/bindirectory. - Connect to the Uptime Infrastructure Monitor DataStore as the root user by executing the following:
mysql -uroot -puptimerocks - Once connected to the database, run the following statement:
grant all privileges on uptime.* to "uptime"@"%" identified by "uptime";
This allows the uptime user to connect to the database from any external host. For additional security, you can replace the%with the actual hostname or IP address of the reporting instance. - Run the following statement:
flush privileges;
Increase the MySQL connection pool size:
If you are using the bundled MySQL database, increase the size of the connection pool, because each Uptime Infrastructure Monitor instance attempts to open 100 database connections, and the MySQL default is 151.
- Open the
<uptime>/mysql/my.inifile in an editor. - Change the
max_connectionsvalue to 201 from its default value of 151. - Save your changes, then restart the uptime DataStore service to use this modified setting.
Link the Monitoring Station with the reporting instance:
Configure the Monitoring Station to communicate with (and send reports to) the reporting instance, as well as link the reporting instance's content back to the Monitoring Station so your users can access its generated reports.
- Log in to the Monitoring Station Web interface.
- Click the Config tab and click Remote Reporting.
- Click Edit Configuration and do the following:
- Select the Reporting Instance Enabled checkbox.
- Enter the hostname of the Remote Reporting Server.
- If you have modified the
commandPortdefault from9996in the reporting instance'suptime.conffile, update the default Remote Reporting Server Port here.
- Click Test Configuration to ensure you have entered the correct hostname and port information.
- Click Save.
- In the tree panel, click Uptime Configuration.
Enter the following lines to add a custom tab to My Portal that points to the published reports folder on the reporting instance:
Code Block myportal.custom.tab2.enabled=true myportal.custom.tab2.name=Published Reports myportal.custom.tab2.URL=http://reportingInstanceHostname:9999/published/
Change the tab number to the next available number if you already have created any.
Info As an alternative, you can also make the reporting instance's
/GUI/publisheddirectory a mount point for greater flexibility.- Click Update
Verifying the Monitoring Station Can Communicate with the Reporting Instance
After you have set up the Monitoring Station and the reporting instance, verify the two Uptime Infrastructure Monitor instances can communicate with each other:
- Log in to the Uptime Infrastructure Monitor Monitoring Station web interface.
- Click Config on the toolbar.
- Click Remote Reporting.
- Click Test Configuration.
A connection-test message appears, reporting a successful or failed connection.