...
Alert Profiles
Alert Profiles are templates that tell Uptime Infrastructure Monitor how to react to various alerts that are generated by service checks. Alert Profiles enable Uptime Infrastructure Monitor to execute a series of actions in response to the failure of a service check or when a threshold is exceeded. The following diagram illustrates how an Alert Profile works:
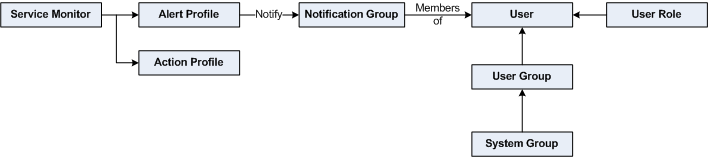
An Alert Profile can send an alert via email, or to a pager or a cell phone. You can configure any or all of these actions to occur simultaneously by associating the Alert Profile to multiple Notification Groups. For example, if a Web server process stops responding, both the system administrator and Web server administrator can be notified.
Custom Alert Formats and Alert Scripts
Alert Profiles include standard message templates for emails and pagers, which are well suited for most alerting needs. However, you can customize the format of the alert using predefined variables. When creating or configuring an Alert Profile, selecting the Custom Format option provides you with a template to modify, and override the message template for the alert type you have selected: 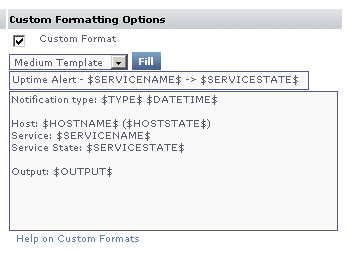
See Custom Alert Message Variables for more information.
In addition to sending alert messages, Uptime Infrastructure Monitor can also execute an alert script. When an outage occurs, the script is run on the Monitoring Station, once for each user who receives notification. Like custom alert messages, alert scripts use predefined variables to represent outage-specific information; these variables are passed to the script at the time of the outage.
For information on alert script variables, see Script Alert Variables. For more information on alert scripts, see the IDERA Knowledge Base article, Creating Custom Alert Scripts in Uptime Infrastructure Monitor Alert Profiles.
Creating Alert Profiles
To create Alert Profiles, do the following:
- On the Uptime Infrastructure Monitor tool bar, click Services.
- In the tree panel, click Add Alert Profile.
The Add Alert Profile window appears. - Type a descriptive name for the profile in the Name of Alert Profile field.
- In the Start alerting on notification number field, enter the number of times an error must occur before Uptime Infrastructure Monitor sends an alert notification.
- Enter the number of times to re-send the notification in the End alerting on notification number field.
You can also select the Never Stop Notifying check box to have Uptime Infrastructure Monitor send notifications indefinitely. - Select one or more of the following notification options:
Email Alert
Sends the alert to the email addresses of the members of a Notification Group.Pager Alert
Sends the alert to the pagers of the members of a Notification Group.Script Alert
Executes an alert script on the Monitoring Station, once for each user who receives notification of the alert.
Because this alert option relies on a script or batch file, enter its name and path in the Script Path field (for example, on Linux,/usr/local/uptime/scripts/scriptAlert.sh).
- If you are using an email or pager notification, and want to use a custom message instead of the standard template, click the Custom Format check box to begin creating a custom alert message. Use the following steps to create the message:
- To expedite message creation, select a Short Template, Medium Template, or Long Template, then click Fill.
- Optionally modify the alert subject header.
- Optionally modify the alert message body.
- Select one or more Notification Groups that receive the notifications.
- Optionally attach this alert profile to one or more existing Service Monitors.
- Click Save.
Viewing Alert Profiles
To view Alert Profiles, do the following:
- On the Uptime Infrastructure Monitor tool bar, click Services.
- In the tree panel, click View Alert Profiles.
The Alert Profiles subpanel appears. The subpanel displays the settings that you configured when you created the profile, as well as a list of the services that are attached to the profile. - To test whether the profile sends alerts, click Test Alert Profile.
A popup window appears, and the alert is sent using the notification method (email, pager, or script) that is specified in the profile. The following is an example of an email alert:
Notification type: Problem 27/4/2006 09:19
Host: Test Host (OK)
Service: Test Monitor
Service State: OK
Output: This is a test notification; please ignore.
When the alert is sent, the messageAlert Profile Testedappears in the popup window. If an error message appears in the popup window, edit the profile and test it again.
Editing Alert Profiles
To edit Alert Profiles, do the following:
- On the Uptime Infrastructure Monitor tool bar, click Services.
- In the tree panel, click View Alert Profiles.
- Click the Edit Alert Profile icon beside the name of the profile that you want to edit.
The Edit Alert Profile window appears. - Edit the Alert Profile fields as described in the section, Creating Alert Profiles.
Associating Alert Profiles to Elements
You can associate an Alert Profile to any Service Monitor, Application, or SLA if their state changes from OK to Warning or Critical. Alert Profiles are normally associated with any of these monitored items at the time of their configuration; you can also modify Alert Profile associations using existing service monitor definitions.
See Using Service Monitors, Working with Applications, and Adding and Editing SLA Definitions for more information about configuring Service Monitors, Applications, and SLAs, respectively.
...
Monitoring Periods
Monitoring Periods are the times over which a service monitor is actively monitoring a host. The Monitoring Periods also apply to the times when Uptime Infrastructure Monitor sends alerts
Uptime Infrastructure Monitor comes with the following Monitoring Periods:
- 24x7 – Monitoring is performed 24 hours a day, seven days a week.
- 9am to 5pm weekdays – Monitoring is performed from 9 a.m. to 5 p.m., Monday to Friday.
- Never – No monitoring is carried out.
You can add Monitoring Periods that suit your needs. For example, you can create a Monitoring Period called " Weekends" that only monitors a host from 12:00 a.m. on Saturday to 11:59 p.m. on Sunday.
Adding Monitoring Periods
To add Monitoring Periods, do the following:
On the Uptime Infrastructure Monitor tool bar, click Services.
- In the tree panel, click Add Monitoring Period.
The Add Monitoring Periods window appears. - Type a name in the Monitoring Period Name field.
- In the Definition section, enter one or more time period expressions that combine to create a full Monitoring Period definition.
See Time Period Definitions for information on the types of time period expressions that are valid in Uptime Infrastructure Monitor. - Click Save.