...
Viewing Service Level Agreements
Service level agreements are viewed in Dashboards for monitoring, and in My Infrastructure for configuration.
Viewing SLA Status
You can view the status of all your service level agreements in the SLAs dashboard, which can be accessed by clicking Dashboards.
For more information about what kind of SLA information you can view on the SLAs dashboard, see Viewing All SLAs.
Viewing SLA Details
The details of an SLA definition can be viewed in the Service Level Agreement General Information subpanel. This can be accessed from the My Infrastructure panel by clicking the SLA name listed among the Elements, or from the Global Scan dashboard by clicking the Info tab in the Tree panel, then clicking Info.
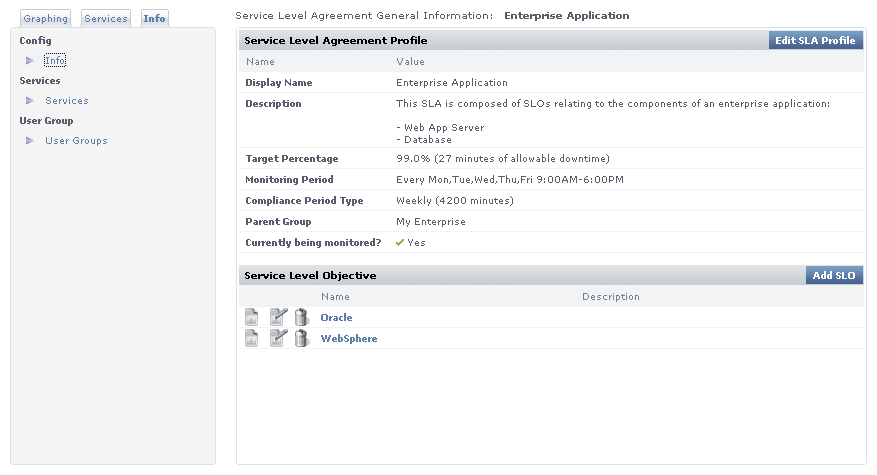
The General Information subpanel displays a summary for the SLA that includes the following:
- Target Percentage: the targeted percentage of up time of the SLA’s component services over the Monitoring Period
- Monitoring Period: the days and time frames during which uptime is measured
- Compliance Period Type: the compliance period intervals over which SLA compliance is measured (i.e., weekly or monthly)
- Service Level Objectives: a listing of the SLOs into which the SLAs services is organized
You can view information about the services that make up the SLA by clicking the Services tab in the Tree panel.
Clicking the Graphing tab in the Tree panel, then clicking Current Status displays a verbose status summary of the SLA that includes the following:
- Trend Analysis: SLA status indicator for the current compliance period
- Compliance Period and Allowable Downtime Used: the current progress through the compliance period, and how close the SLA is getting to reaching a critical state
- Achieving (SLA): how close the SLA is to its performance target; how recoverable a failing SLA is, based on how far it is from its target
- Achieving (SLOs): an SLO-level breakdown of how well or poorly each SLO is meeting its performance target; how recoverable failing SLOs are, based on how far it is from its target
See A Note About SLOs and Compliance for more information about SLOs and the Achieving statistic.
SLA Compliance Calculation
SLA downtime occurs when any of the SLA’s services are in a critical state. An SLA is compliant if its downtime has not exceeded a maximum number of minutes over a one-week or one-month Monitoring Period.
For example, consider an SLA whose compliance period type is weekly and its Monitoring Period is Monday through Friday, 9 p.m. to 5 p.m. The Monitoring Period consists of five eight-hour days--in other words, 40 hours, or 2400 minutes. If the SLA’s target is 95%, it has 120 minutes of allowable downtime for any of its services.
Reporting SLA Status
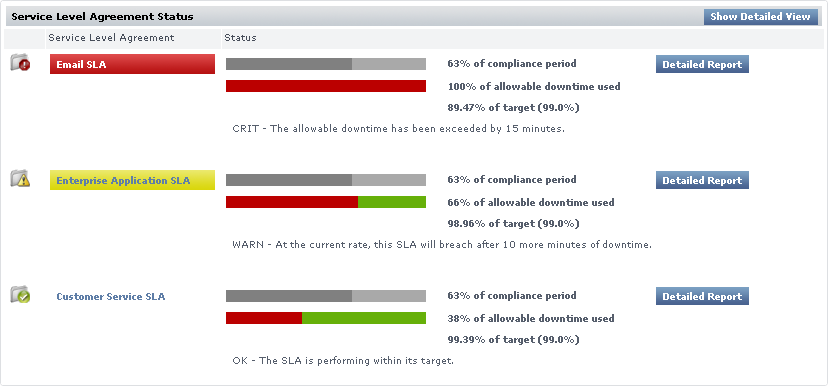
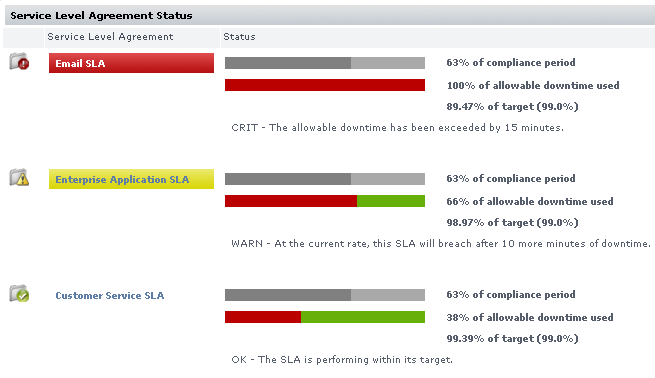
An SLA’s reported status on the Global Scan dashboard includes the following in the form of progress bars: the percentage of the Monitoring Period that has expired, and the percentage of allowable downtime consumed during the Monitoring Period. (See Viewing All SLAs for information about SLA information on the Global Scan dashboard.)
An SLA reaches a critical state when its allowable downtime is depleted. An SLA reaches a warning-level state when its allowable downtime, at the current rate of use, is depleted before the compliance period has ended. These states, and their conditions under which they happen, are shown on Global Scan.
Handling Simultaneous Service Downtime
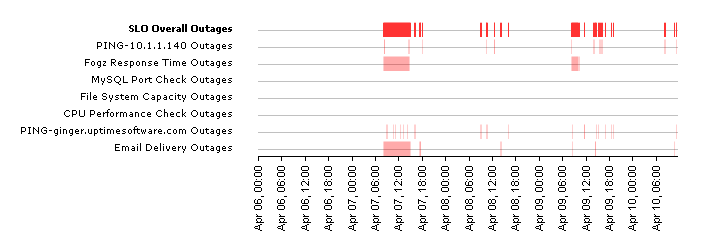
The simultaneous downtime of multiple services does not cumulatively impact an SLA’s remaining allowable downtime; the term "allowable downtime" can be expanded to mean the amount of time during which there can be any service downtimes (until the compliance period has ended, after which the counters are reset).
In the following outage graph for an SLO, note that any time an outage is experienced--whether by one or four services--the SLO is deemed to have experienced an outage, which is reflected in the top red line:
A Note About SLOs and Compliance
It is important to note the role an SLO plays regarding SLA compliance: SLOs exist to help you conceptually separate services into logical groups that make it easier for you to monitor, diagnose, and set performance goals for them. Although the descriptions of "allowable downtime" in the previous section implied that service downtime affects SLA downtime, it is more accurate to say that service downtime affects SLO performance--which in turn, affects SLA downtime.
SLO outages affect reported SLA compliance in the same way service outages affect SLO compliance: allowable downtime is reduced when any outage is experienced. This is also pertinent if you are scanning the "Achieving" statistic for an SLA Summary. (This statistic can be viewed in the Service Level Agreement subpanel of My Infrastructure, by clicking the Graphing tab, then clicking Current Status.)
You can verify how well or poorly an SLA is achieving its target, but you can also view how the component SLOs are performing for the time period. In the following example, the email server performance SLO is achieving its 99.0% target. Although the email server availability SLO is achieving its target (99.43% vs. 99%), both SLOs' downtime affects SLA downtime. In this case, combined SLO downtime results in the SLA only achieving 89.47% of its target—resulting in a critical status.
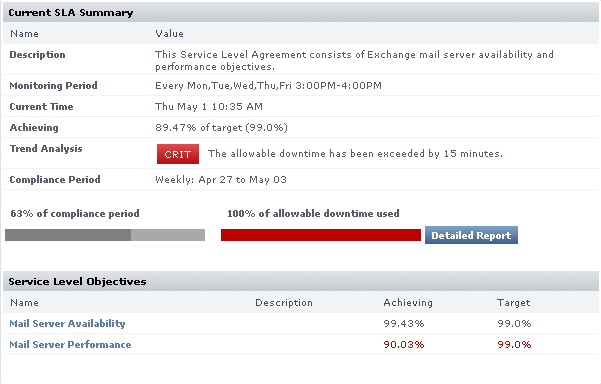
See Viewing SLA Details for information on how to find information such as the Achieving statistic in an SLA summary.
...
Adding and Editing SLA Definitions
Adding and using an SLA requires that you first define the SLA, then add one or more SLOs to it.
| Info |
|---|
| When you create an SLA, it is inserted into the current compliance period. For example, a newly created SLA that reports over a monthly compliance period is, if created on the 15th of the month, already around 50% through the period. |
Adding a Service Level Agreement
To add a service level agreement to Uptime Infrastructure Monitor, do the following:
- In the My Infrastructure panel, click Add Service Level Agreement.
The Add Service Level Agreement window appears.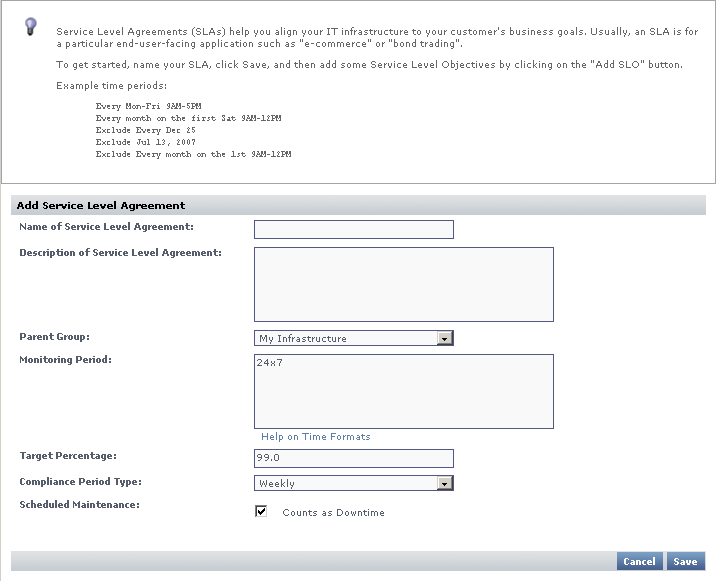
- Enter a descriptive name for the SLA in the Name of Service Level Agreement field.
This name appears on both My Infrastructure and Dashboards. - Optionally enter a description for the SLA in Description of Service Level Agreement field.
Although this step is optional, this description appears in generated SLA reports; therefore, it is recommended that you provide a detailed description of the SLA including what it is meant to accomplish and of which SLOs it consists. - Optionally select the group of systems in your Uptime Infrastructure Monitor environment with which this system is associated from the Parent Group dropdown list.
By default, the SLA is added to the My Infrastructure group.
For more information on groups, see Working with Groups. - If it is not continuous (i.e.,
24x7), enter a Monitoring Period during which the SLA’s compliance is measured.
You must create a time period definition (e.g.,Every Mon-Sat 8AM-6PM). See Monitoring Periods and Time Period Definitions for more information. - If it is not the default 99.0%, enter a Target Percentage against which the SLA’s compliance is measured.
- Ensure you have selected the correct Compliance Period Type from the dropdown list.
- Indicate whether scheduled system maintenance counts as downtime.
- Click Save.
Once saved, the SLA’s Service Level Agreement General Information subpanel is displayed (see Viewing SLA Details for more information). From this page, you can add SLOs, as well as associate Alert Profiles and Action Profiles to the SLA.
Adding Service Level Objectives to an SLA
To add a service level objective to an SLA, do the following:
- In the My Infrastructure panel, click the name of the Service Level Agreement that you want to edit.
The Service Level Agreement General Information subpanel appears. - Click Add SLO.
The Add Service Level Objective window appears.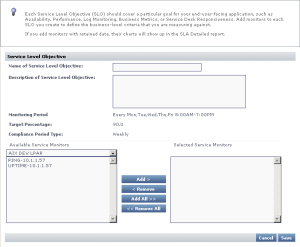
- Enter a descriptive name for the SLO in the Name of Service Level Objective field.
This name appears anywhere in My Infrastructure and Dashboards. - Enter a description for the SLO in Description of Service Level Objective field.
Although this step is optional, this description appears in SLA Detailed reports; therefore, it is recommended that you provide a detailed description of the SLO including what goal is accomplished, and of which service monitors it consists. - Add a service monitor to be associated with the SLO by first selecting its host from the dropdown list, then adding the service monitor.
- Continue to add service monitors to the SLO as required.
- Click Save.
Associating Alert and Action Profiles to an SLA
To add a service level objective to an SLA, do the following:
- In the My Infrastructure panel, click the name of the Service Level Agreement that you want to edit.
The Service Level Agreement General Information subpanel appears. - Associate Alert Profiles with the SLA by clicking Edit Alert Profiles.
- In the Alert Profile Selector pop-up window, select one or more of the Available Alert Profiles from the list, then click Save.
- If required, associate Action Profiles with the SLA by clicking Edit Action Profiles.
- In the Action Profile Selector pop-up window, select one or more of the Available Action Profiles from the list, then click Save.
Editing SLA and SLO Definitions
To edit a service level agreement, do the following:
- In the My Infrastructure panel, click the gear icon beside the Service Level Agreement that you want to modify, then click Edit.
The Edit Service Level Agreement window appears. - Edit the SLA as described in the previous section.
See Adding a Service Level Agreement for information. - Because SLA reporting and monitoring is based on weekly or monthly compliance periods, changing any of the following on an existing SLA affects the reported SLA status and generated reports:
- Monitoring Period
- target percentage
- compliance period type
Info Any changes made are immediately reflected in any SLA reporting.
To edit a service level objective, do the following:
- In the My Infrastructure panel, click the name of the Service Level Agreement that you want to modify, then click Edit.
The Service Level Agreement General Information subpanel appears. - Click the SLO’s corresponding Edit icon.
Edit the SLO as described in the previous sections.
See Adding Service Level Objectives to an SLA for information.
Because SLA reporting and monitoring is based on weekly or monthly compliance periods, changing the service monitors that make up an SLO definition affects the reported SLA status and generated reports.Info Any changes made are immediately reflected in any SLA reporting.