| Table of Contents |
|---|
Introduction
With the introduction of the Extension Manager in Uptime Infrastructure Monitor in up.time 7.3, plugins and gadgets are now even easier to install. As part of this change, we have also posted the source code for all plugins on github. Use these examples as starting templates for building your own plugins.
Plugins
What's a plugin?
Plugins are custom service monitors that allow Uptime Infrastructure Monitor to monitor and collect metrics from a variety of different sources. In most cases they're a combination of XML which defines the input and output variables, and some simple shell scripts that handle the actual task of monitoring. These monitors usually consists of some sort of login or connectivity check, as well as exposing key metrics in a format that can be understood by Uptime Infrastructure Monitor. The specifics of the scripts themselves depend on what protocol and libraries are required to the talk to device/system/service on the other end. But this doc will explain howto use element details from Uptime Infrastructure Monitor to control where these scripts are targeted. As well howto define your own input variables that are stored as service monitor settings in the Uptime Infrastructure Monitor.
Inputs Variables
Uptime Infrastructure Monitor uses Environment Variables as it's main way of exposing information to all custom scripts. The most important of these environment variables is UPTIME_HOSTNAME which provides the hostname of the element the service monitor is running against. Next comes the various input variables from the monitor's xml file, which provide the specific details needed for the script itself. The best way to understand how this works is to take a look at an example of the xml definition a monitor, how that looks as service monitor settings in the GUI, and finally how all this information ends up as environment variables in the script.
A good example of this is the 'Custom Remote Monitor' as this plugin also provides a great starting point for custom monitors that also rely on a an agent side script. But for now we're just going to focus on the XML details and the script that runs directly on the monitoring station itself. The full contents of the xml file are available on github here .
XML - Grid Info
The first section of the XML file contains details about the name of the plugin/service monitor and which category its shows-up under on the 'Add Service Monitor' screen.
...
Next comes the elements section of the XML file. This is a list of element tags which define the input and output variables you see when editing a service monitor in the Uptime Infrastructure Monitor GUI. The contents of these variables are stored in the Uptime Infrastructure Monitor datastore just like regular service monitors.
XML - Elements
The first of these elements are the process_linux & process_windows which control which script actually gets run on the monitoring station when a service monitor is triggered.
...
| Code Block | ||
|---|---|---|
| ||
<element name='port' parameter_type='input' data_type='integer' gui_basic='1' range_type='0' units=''> <control_options>size:8</control_options> <default_value>9998</default_value> <short_description>Agent Port</short_description> <long_description>up.time Agent Port (default is 9998)</long_description> <validation_rule/> <error_message/> <gui_type> <integer/> </gui_type> </element> <element name='password' parameter_type='input' data_type='string' gui_basic='1' range_type='0' units=''> <control_options>size:8</control_options> <default_value></default_value> <short_description>up.time Agent Password</short_description> <long_description>Password setup on the agent system</long_description> <validation_rule/> <error_message/> <gui_type> <password/> </gui_type> </element> <element name='remote_script' parameter_type='input' data_type='string' gui_basic='1' range_type='0' units=''> <control_options>size:8</control_options> <default_value></default_value> <short_description>Remote Script / Command</short_description> <long_description>Script name (posix) or command (win) setup on the agent</long_description> <validation_rule/> <error_message/> <gui_type> <string/> </gui_type> </element> <element name='args' parameter_type='input' data_type='string' gui_basic='1' range_type='0' units=''> <control_options>size:8</control_options> <default_value></default_value> <short_description>Arguments</short_description> <long_description>Arguments that will be sent to the remote script</long_description> <validation_rule/> <error_message/> <gui_type> <string/> </gui_type> </element> |
Edit Service Monitor View:
Now that we've talked about the details that go into a plugin's XML file, let's take a look at how these input variables are displayed in the Uptime Infrastructure Monitor GUI when creating an instance of the 'Custom Remote Monitor':
...
- The first thing you'll notice is that we don't see either the process_windows or process_linux fields, but that's to be expected here, as those fields where set as hidden.
- The contents of the password field are obscured as expected.
- The Remote Script & Arguments fields are basic string fields.
- You can also see the two output values for this monitor, but we'll talk about those more later.
Environment Variables
Next let's take a look at how all these parameters and input fields come together as the environment variables that are used by the script itself. Environment variables aren't normally/displayed or retained by the service monitor when it runs, but they're easy to capture for testing/debugging purposes by adding the appropriate command to your shell/bat script:
...
- They all start with
UPTIME_and the contents of the name attribute from the element tag. - The
UPTIME_HOSTNAMEhas the hostname of the element the monitor is running against. - The rest of our input variables show-up as expected with the same contents as we set in the GUI example above.
Shell/Bat Wrapper Scripts
Now let's take a quick look at what the custom_remote.bat & custom_remote.sh scripts actually do with these environment variables. As mentioned above, most of the Uptime Infrastructure Monitor provided plugins rely on a common PHP script to perform the actual task of monitoring. As such the bat & sh scripts are just responsible for telling Uptime Infrastructure Monitor's bundled php executable to run the required script, pass along the environment variables in the correct order. The specifics of how this done obviously varies between both Windows and Linux, so let's take a look at both methods.
...
We won't get into the details of the rcs.php script itself as this will typically change depending on the details of the plugin itself. But the full contents of this file on github here if your interested.
Output Variables
Now that we've looked at all the details that go into a plugin scripts input variables. All the way from the xml file, the Edit Service Monitor Screen, and how they finally get exposed to the custom script as environment variables. Let's take a look at how a custom monitor can return it's output back to Uptime Infrastructure Monitor, and the different things we can do it with.
XML - Output Variables
Just like input variables, output variables are also defined in the xml file via the same element tags. They're covered by the same basic rules outlined above, and full details for their XML definitions are available here: 'Integration Guide -> Plugin Guide' .
...
The general take-away from this test service monitor example is that when Uptime Infrastructure Monitor is able to parse/understand the output from a script, the matched up variables will be listed line by line after the message. With the 'name' of the variable replaced by it's short description. If you don't see your output variable listed like this, then double check the names of your output variables and how the script itself is returning its output.
Installing Plugins
Now that we've seen how plugin monitors are made of a combination an XML file that defines the various inputs/outputs and a script performs the actual task of monitoring, Let's take a look how these pieces are packaged together, and how Uptime Infrastructure Monitor knows which plugins are available for install.
Packaging Plugins
The best way to understand how Uptime Infrastructure Monitor plugins are packaged is to take a look at the zip file for a plugin itself. We'll use the same 'Custom Remote Monitor' from above as our example again. The actual zip file that is used when installing the plugin is located within this repo's 'dist' folder, along with some .upk files (The legacy plugin format used by older versions of Uptime Infrastructure Monitor).
...
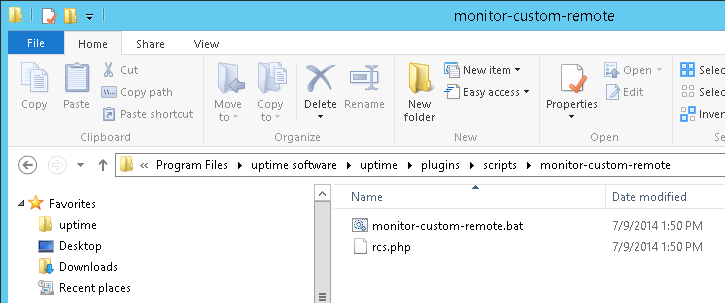
Similarly on a Windows monitoring station that file would end up in the location similar to below. (In this example Uptime Infrastructure Monitor was installed into the default C:\Program Files\uptime software\up.time\ location for Windows). The 'monitor-custom-remote.bat' file comes from a similar sub-folder within the plugin's 'files-win' folder.
Extension.json
Now that we've seen how a plugin monitor is packaged into it's own zip file,the last piece we need to look at the extension.json file that the monitoring station uses to know which plugins are available for install and where to get the associated zip files. By default Uptime Infrastructure Monitor will attempt to get these details from this location: http://the-grid.uptimesoftware.com/extension.json on our website.
...
The next most important fields for a plugin are the 'name' & 'version' as these are used to figure out which plugins are currently installed within Uptime Infrastructure Monitor and if they're running the current version. A combination of these two fields controls whether a user will see the Installed/Install/Upgrade buttons within the extension manager. The contents of the name field in the JSON needs to exactly match the XML's class tag.
Contributing a Plugin
By now you've hopefully been able to create your own plugin monitor for use with Uptime Infrastructure Monitor and are asking yourself how you can share your creation with other Uptime Infrastructure Monitor users.
Choosing a License
One thing you may not of thought about much more when creating software/scripts for internal project is 'What Copyright License should I release this under?'
...
Of the licenses listed on the Creative Commons website, we recommend using the Attribution-ShareAlike with plugins as it provides the best fit for how plugins are typically created and expanded upon. Once you've chosen the appropriate license for your plugin, you'll need to mention it somewhere within the plugin itself, typically either as part of the readme itself or by adding a license.txt file to your plugin repo. See this page on github for some common ways people handle this.
Putting your plugin on github
If you haven't been using git or some other version control tool while creating your plugin then it's time to create a repository for it on github, as that's the easiest way to share your creation with us and make it available for download via the Extension Manager.. Here's some documentation on github.com that covers the basics of howto create your own repository and a general introduction for working with git.
...