...
Action Profiles
Action Profiles are templates that direct Uptime Infrastructure Monitor when it encounters a problem on a monitored system. You can associate an Action Profile to any Service Monitor, Application, or SLA if their state changes from OK to Warning or Critical. Action Profiles are normally associated with any of these monitored Elements at the time of their configuration; Action Profile associations can also be changed when you are modifying existing service monitor definitions.
See Using Service Monitors, Working with Applications, and Adding and Editing SLA Definitions for more information about configuring Service Monitors, Applications, and SLAs, respectively.
Actions include one of the following tasks:
- write an entry to a log file
- run a recovery script that can reboot a non-responsive server; or restart an application, process, or service
- stop, start, or restart a Windows server
- initiate a VMware vCenter Orchestrator workflow
- send an SNMP trap to a specific trap host and trap community
As templates, Action Profiles can be reused for any number of Service Monitor configurations. This means you can create a series of them as standard actions used to respond to typical types of problems you may encounter, depending on what role a Service Monitor is playing (for example, availability or performance).
VMware vCenter Orchestrator Workflow Actions
If an administrator has integrated Uptime Infrastructure Monitor with VMware vCenter Orchestrator (see VMware vCenter Orchestrator Integration), you can configure Action Profiles to initiate Orchestrator workflows.
Orchestrator is a VMware vCenter Server add-on that allows its administrators to create workflows that automate vCenter management tasks. These Orchestrator workflows are open ended: all vCenter actions are available for automation through the processing of parameters and runtime arguments. Uptime Infrastructure Monitor Action Profiles can be configured to provide input parameters to specific workflows, thus integrating vCenter management with Uptime Infrastructure Monitor’s monitoring and alerting capabilities.
For example, if Uptime Infrastructure Monitor is monitoring memory, CPU, and hard disk use for a virtualized server, the passing of performance thresholds can trigger an Action Profile that, in turn, triggers an Orchestrator workflow that creates a new virtual machine to alleviate resource strain. In a converse example, if Uptime Infrastructure Monitor is monitoring a virtualized server for long periods of inactivity, a triggered Action Profile can initiate an Orchestrator workflow that shuts down the instance to free up resources.
By tightly integrating Uptime Infrastructure Monitor’s monitoring and alerting with VMware vCenter Orchestrator’s automated virtual environment administration, you can accelerate your organization’s reaction time with virtual systems management, and map established policies to automated actions.
When configuring Action Profiles, Uptime Infrastructure Monitor communicates with Orchestrator and dynamically produces a list of all available workflows. (This includes any third-party workflow packages that are installed on the Orchestrator server, including the Uptime Infrastructure Monitor Orchestrator package.)
When a workflow is selected, and the Get Parameters button is clicked, the corresponding input parameter fields are dynamically displayed, allowing you to specify parameter values required to completely configure the workflow for execution should an Uptime Infrastructure Monitor alert initiate it.
Orchestrator Input Parameter Variables
When configuring a VMware vCenter Orchestrator workflow, you have at your disposal a set of Uptime Infrastructure Monitor-specific variables that can be entered as parameter variables, and whose ensuing runtime values are passed to the Orchestrator workflow during execution. The variables available to you are those that are used when creating a custom alert format. See Custom Alert Message Variables for information.
SNMP Trap Actions
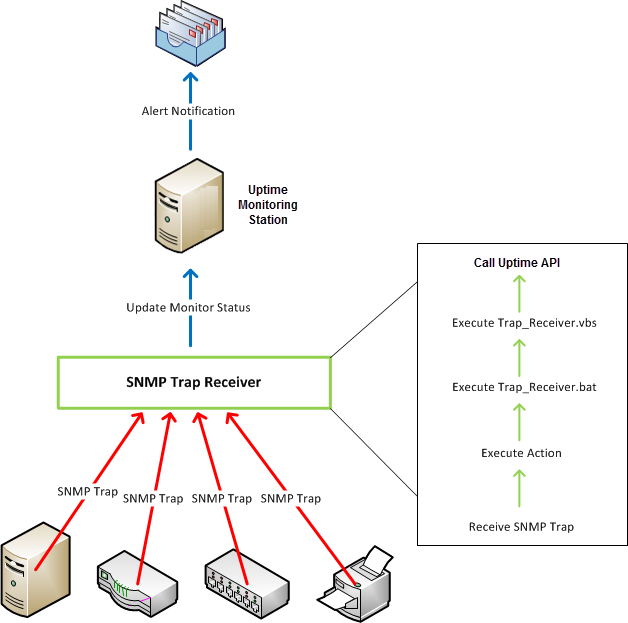
You can also configure an Action Profile to send an SNMP trap to a particular host. An SNMP trap is a notification issued by a system that is running SNMP when a problem occurs. The host to which the SNMP trap is sent must be running an SNMP trap listener, such as snmptrapd by Net-SNMP. You can use any SNMP trap receiver as long as it can execute scripts when traps are received. When an SNMP trap is sent:
- the SNMP-enabled device sends an SNMP trap to the snmptrapd service
- snmptrapd compares the trap to the list of filters in the snmptrapd.conf file
- when the trap matches the uptime filter, the trap_to_ext_event.pl perl script is executed
- trap_to_ext_event.pl calls the Uptime Infrastructure Monitor API to update the status of the External Check monitor associated with the device
- if an Alert Profile is associated with the monitor, an alert notification is sent out
Below is a diagram depicting the process:
.
If you use SNMP traps, the trap message is sent in the format specified by the Uptime Infrastructure Monitor MIB. This MIB is found in the/scripts directory. The Uptime Infrastructure Monitor enterprise OID is .1.If you use SNMP traps, the trap message is sent in the format specified by the Uptime Infrastructure Monitor MIB. This MIB is found in the /scripts directory. The Uptime Infrastructure Monitor enterprise OID is .1.3.6.1.4.1.24216.Install Net-SNMP and Perl
- Download Net-SNMP from http://sourceforge.net/projects/net-snmp/files/net-snmp%20binaries/5.6.1.1-binaries/net-snmp-5.6.1.1-1.x86.exe/download
- Download Strawberry Perl from http://strawberryperl.com/download/5.20.1.1/strawberry-perl-5.20.1.1-64bit.msi
- Execute the Net-SNMP installer and accept the defaults.
- Execute the Strawberry Perl installer and accept the defaults
Create a snmptrapd configuration file and Perl script
Create a new file called snmptrapd.conf in the C:\usr\etc\snmp directory with contents similar to the following ("public" on the first line is the SNMP community string - feel free to changed accordingly, and the path to Uptime Infrastructure Monitor on the second line should be changed accordingly):
authCommunity log,execute,netpublictraphandledefaultC:\Strawberry\perl\bin\perl.exe"C:\Program Files\uptime software\uptime\scripts\snmp-trap-script\trap_to_ext_event.pl"- In the Start menu, select the Net-SNMP folder, right click Register Trap Service and choose Run As Administrator
- Start the "Net-SNMP Trap Handler" service
- Create the directory "C:\Program Files\uptime software\uptime\scripts\snmp-trap-script"
- Download and copy this file, trap_to_ext_event.pl, to the directory mentioned in the previous step
This approach assumes that your SNMP trap service monitors all have the same name, "SNMP Trap (member)", and are managed via a Service Group.
There are two logs that are created with this solution, one when traps are received by the Net-SNMP Trap Handler service and another when the trap is sent into Uptime Infrastructure Monitor by the perl script. This helps to narrow down an issue if one arises.
Uptime Infrastructure Monitor Configuration
Create a new monitor called "SNMP Trap" and assign it to a Service Group, so that it can be applied to numerous Elements in Uptime Infrastructure Monitor.
- Create a Service Group for your devices that will send SNMP traps to Uptime Infrastructure Monitor.
- On the Uptime Infrastructure Monitor tool bar, click Services.
- In the tree panel, click Add Service Group.
- Select Regular from the drop-down, and then click "Continue...".
- Enter "SNMP Trap Group" as the name for the Service Group and, optionally, a description for the group.
- In the "Available Element Groups" and "Available Elements" lists, choose the Element Groups and Elements that you want to have SNMP Trap monitors created for.
- Click Finish.
- Create an External Check monitor and assign it to the "SNMP Trap Group" Service Group.
- On the Uptime Infrastructure Monitor tool bar, click Services.
- In the tree panel, click Add Service Monitor.
- Select External Check from the list of available Service Monitors, and then click “Continue…”.
- Input “SNMP Trap” as the Service Name.
- Select the "Service Group" radio button and choose "SNMP Trap Group" from the drop down.
- Choose an Alert Profile to have alert messages sent to the appropriate users.
- Click Finish.
Creating Action Profiles
To create Action Profiles, do the following:
- On the Uptime Infrastructure Monitor tool bar, click Services.
- In the tree panel, click Add Action Profile.
The Add Action Profile window appears. - Enter a name for this profile in the Name of Action Profile field.
- Specify the number of times an error must occur before Uptime Infrastructure Monitor sends a notification in the Start action on notification number field.
- Specify the number of times actions are carried out in the End action on notification number field.
Optionally, select the Never Stop Notifying option to continually carry out the action in this profile until the problem is resolved. - If VMware vCenter Orchestrator integration is enabled, and you want the Action Profile to drive an Orchestrator workflow, use the following steps:
- In the Select Workflow field, input a workflow to configure.
You can either scroll through and select the workflow from the drop-down list, or begin typing the workflow’s name. - Click Get Parameters.
Uptime Infrastructure Monitor retrieves information from the Orchestrator server and dynamically display configuration fields for the chosen workflow’s input parameters. - Configure the input parameter fields for the workflow.
For information on the specific configuration parameters available for the chosen workflow, consult the appropriate developer’s documentation.
- In the Select Workflow field, input a workflow to configure.
- If you want the Action Profile to write to a log, in the Log File field, enter the name and path to a log file on the Monitoring Station to which error information is written.
- If you want the Action Profile to run a recovery script, in the Recovery Script field, enter the name and path to a script that reboots a server, or restart an application, process, or service.
The recovery script also has the following information appended to it:- the date and time on which the error occurred
- the type of error notification that was sent
- the name of the host on which the error occurred
- the state of the host
- the name of the service that threw the error
- the state of the service
- the output that was generated by the error
for example:"/usr/local/uptime/recover.sh" "24/12/2014 5:01:05" "Problem" "printserver" "null" "WinSrv-Print Spooler" "CRIT/threshold error" "servicestatus: Not Running does not match Running (Service 'Print Spooler' found, status: Not Running, took 12ms)"
For information on predefined variables that can be used in Action Profile scripts, see Recovery Script Variables.
Info You can also use the recovery script to file trouble tickets with a system like Remedy, or to interact with third-party software packages.
- If you are setting up an Action Profile for a Windows server, you can also leave the Windows Service as Agent, and complete the following fields:
Windows Host
The name of the host on which the service is running.Info Enter
$HOSTNAME$in this field to create a dynamic hostname. For failing services that call this Action Profile, the corresponding hostname is used when this action runs.You can use this dynamic hostname in conjunction with service groups, where an issue can originate from one of many hosts.
- Agent Port
The port on which the Uptime Infrastructure Monitor agent that is installed on the system is listening. The default is 9998. - Use SSL
Select this option if Uptime Infrastructure Monitor securely communicates with the host using SSL (Secure Sockets Layer). - Agent Password
Enter the password that is required to access the agent that is running on the monitored system. For information on setting the agent password, see the Uptime Infrastructure Monitor Knowledge Base article, What is the password for the Windows agent? Windows Service
The display name of the specific Windows service to which the Action Profile applies. The display name of a service appears in the Name column of the Services Control Panel, or in the Description column of the Windows Task Manager Services tab.Info The service display name must be entered verbatim, including spaces, otherwise it is not correctly processed. Double-clicking a service name in the Services Control Panel opens a properties window where you can highlight and copy the service Display name.
- Action
Select one of the following actions:- None
- Start
- Stop
- Restart
- If you are setting up an Action Profile for a Windows server that is using a WMI implementation, you can also select the Windows Service as WMI, and complete the following fields:
- WMI Host:
The name of the host on which the service is running. - Windows Domain:
The Windows domain in which WMI is implemented. - Username:
The name of the account with access to WMI on the Windows domain. - Password:
The password for the account with access to WMI on the windows domain. Windows Service
The display name of the specific Windows service to which the Action Profile applies. The display name of a service appears in the Name column of the Services Control Panel, or in the Description column of the Windows Task Manager Services tab.Info The service display name must be entered verbatim, including spaces, otherwise it is not correctly processed. Double-clicking a service name in the Services Control Panel opens a properties window where you can highlight and copy the service Display name.
- Action
Select one of the following actions:- None
- Start
- Stop
- Restart
- WMI Host:
- If you want to send SNMP traps to a particular host, complete the following fields:
- SNMP Trap Host
The name of the host that monitors SNMP traps. - SNMP Trap Port
The port number on the trap host to which the SNMP trap is sent. - SNMP Trap Community
The name which acts as a password for sending trap notifications to the trap host. - SNMP Trap OID (optional)
The object identifier (OID) that identifies the SNMP trap - for example,.1.3.6.1.2.1.34.4.1.7.
- SNMP Trap Host
- If Splunk integration is enabled, and you want the Action Profile to write to the Splunk log, complete the following fields:
- Splunk Hostname
The host name of the server on which Splunk is running. - Logging Port
The port on which the Splunk server is listening for logging requests. This port is configured in Splunk, and you must contact the Splunk administrator for this information. - Click the Use SSL option to securely access the Splunk server using SSL.
- Splunk Hostname
- Optionally attach this alert profile to one or more existing Service Monitors.
- Click Save.
Viewing Action Profiles
To view Action Profiles, do the following:
- On the Uptime Infrastructure Monitor tool bar, click Services.
- In the Tree panel, click View Action Profiles.
The Action Profiles subpanel appears, displaying the settings that you configured when you created the profile, as well as a list of the services that are attached to the profile. - To test whether the profile works, click the Test Action Profile button.
A popup window appears, and the Monitoring Station tries to carry out the action defined in the profile. When the action is completed, the message Action Profile tested appears in the popup window.
If an error message appears in the popup window, edit the profile and test it again.
Editing Action Profiles
To edit Action Profiles, do the following:
- On the Uptime Infrastructure Monitor tool bar, click Services.
- In the tree panel, click View Action Profiles.
- Click the Edit Action Profile icon beside the name of the profile that you want to edit.
The Edit Action Profile window appears. - Edit the Action Profile fields as described in the section Creating Action Profiles.
...