...
Alongside the Infrastructure Group, the vCenter Server itself appears as a top-level Element in Infrastructure. It includes the hierarchy of objects that comprise the Hyper-V Server inventory. Click the + icon beside your Hyper-V Server to expand its view.
Consider this example Hyper-V:
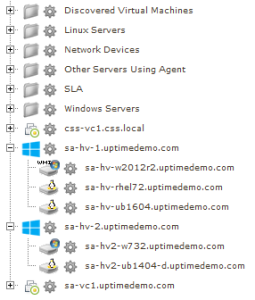

Virtual machines In the above example, the datacenter's cluster of ESX hosts is organized into two resource pools, along with their component virtual machines. Hosts and virtual machines can be moved elsewhere in Infrastructure, but the hierarchy remains intact as a reflection of the vCenter Hyper-V Server:
| Note | ||
|---|---|---|
| ||
Depending on the size of your vCenter Hyper-V Server inventory, importing one could exceed your Uptime Infrastructure Monitor license. If this were to happen, you might see the following:
In this scenario, you need not worry. Uptime Infrastructure Monitor has in fact imported these; it is simply ignoring them. We learn more about this in the next section. |
Validation Step 2 > View the
...
Hyper-V Server Inventory
This validation step can be particularly enlightening if your vCenter Hyper-V Server import exceeded your license, and resulted in automatic exclusion of ESX hosts and VMs from the monitored inventory in Uptime Infrastructure Monitor.
- While in the Infrastructure view, click the vCenter Hyper-V Server's gear icon, then in the pop-up menu, click View.
In the left menu, the Info tab is active. Click Inventory Detail.
This displays a list of all of your vCenter Hyper-V Server's inventory, grouped hierarchically. It is divided into two main groups: Elements that are monitored by Uptime Infrastructure Monitor, and Elements that are currently ignored. Initially, during the vCenter Hyper-V Server import, hosts and VMs that were imported after the Uptime Infrastructure Monitor license was exceeded were placed in the Ignored Elements section. You can use this Inventory Detail view view to ignore monitored Elements, and begin monitoring currently ignored Elements.Info title Pro Tip You can also use this Inventory Detailview to Enable Monitoring for a vCenter Hyper-V Server Element. This can be done when an Uptime Infrastructure Monitor Agent is installed on a VM, allowing Uptime Infrastructure Monitor to collect metrics that are more detailed than what is provided by the vCenter Hyper-V Server.
Validation Step 3 > View Metrics for the
...
Hyper-V Server and a VM
- Click Infrastructure.
- Click the vCenter Hyper-V Server's gear icon, then in the pop-up menu, click Graph Performance. Whenever you take this action with an Element, you are taken to its Quick Snapshot.
Whenever you graph the performance of an Element from the Infrastructure view, its Quick Snapshot is displayed. What exactly is shown depends on the type of Element, which we see throughout this part of the Getting Started Guide. In this case, the vCenter Hyper-V Server's Quick Snapshot shows datacenter-level information that is directly pulled from the vCenter Hyper-V Server metrics:
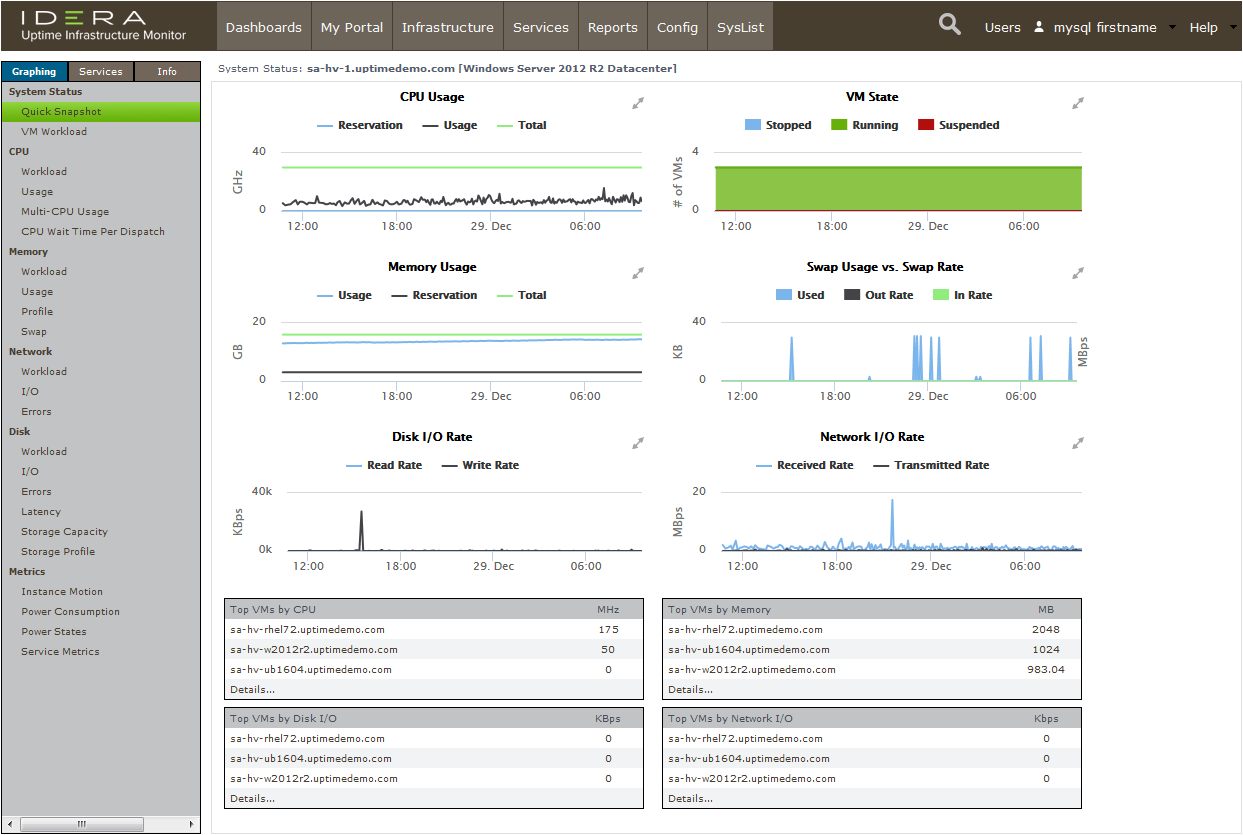
You can incorporate these basic metrics into your Uptime Infrastructure Monitor monitoring plans (such as alerts or reporting). It's more likely, however, that your interest is with the virtual machines that are a part of the vCenter Server inventory. - Click Infrastructure to return to the main inventory view.
- Expand the Discovered Virtual Machines Infrastructure Group, and click the gear icon for any of the VMs. In the pop-up menu, again, click Graph Performance to display that Element's Quick Snapshot. This displays metrics for the VM that are pulled from the vCenter Server's metrics:
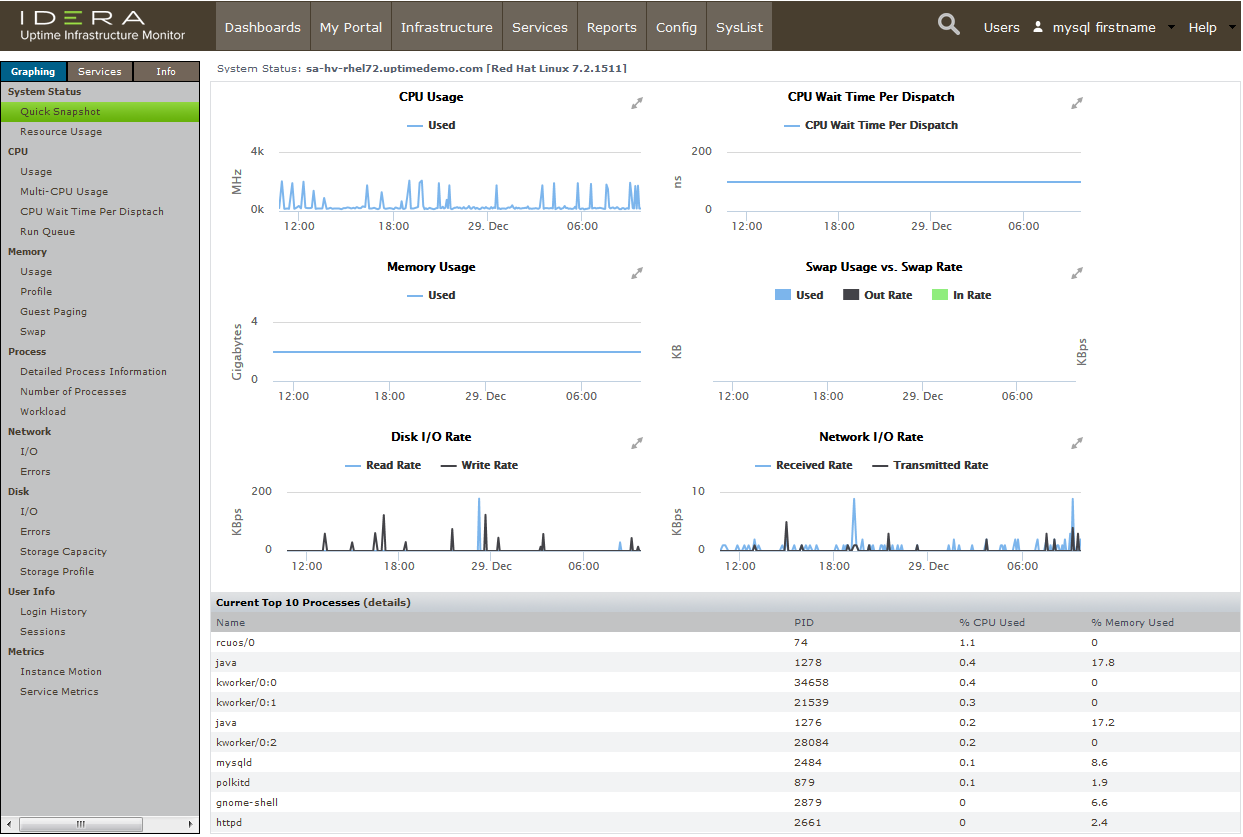
As with the vCenter Server Element's metrics, you can incorporate these into your alerts and reports. However, this "basic VM" view allows you to work only with what the vCenter Server provides; there may be cases where you want to add a little extra "Uptime Infrastructure Monitor power," and install an Uptime Infrastructure Monitor agent on the VM. This is something you learn a bit more about in the next module.
...
| Section | ||||||||||
|---|---|---|---|---|---|---|---|---|---|---|
| ||||||||||
|