...
- Part 1 - Creating Custom Service Monitors in Uptime Infrastructure Monitor
- Part 2 - Creating Custom Service Monitors with Retained Data Collection
- Part 3 - Creating Plugin Service Monitors in Uptime Infrastructure Monitor
Custom service monitors with retained data tracking expand on the basic Custom service monitor by allowing you to retain and graph historical trending information returned from your custom script. This enables you to store up to 10 custom application or business metrics per monitor within Uptime Infrastructure Monitor just like system performance metrics returned by the Uptime Infrastructure Monitor agent. This article builds on the scripts and knowledge that were developed in a previous article. Take some time to review the previous article before continuing.
...
To produce the output listed above, you must edit the script so that it looks like the following example:
| Code Block | ||
|---|---|---|
| ||
#!/bin/sh # This script takes the following arguments: # check_temp.sh hostname port # Example execution: # ./check_temp.sh my-agent 9998 # This script can be placed anywhere on the monitoring station system as long as it is # executable by the uptime user. #First, collect our arguments AGENT=$1 PORT=$2 TMPFILE=/tmp/$$.temp # now use the info above to contact our agent, store the output in a file for parsing `echo -n rexec secretpassword /opt/uptime-agent/my-scripts/show_temp.sh my-arguments | /usr/local/uptime/bin/netcat $AGENT $PORT > $TMPFILE` |
| Note | ||
|---|---|---|
| ||
If you are using agentcmd instead of netcat, replace netcat with agentcmd in the command above. |
| Code Block | ||
|---|---|---|
| ||
`echo -n /opt/uptime-agent/my-scripts/show_temp.sh my-arguments | /usr/local/uptime/scripts/agentcmd -p $PORT $AGENT rexec secretpassword > $TMPFILE` |
For more information, see Using the agentcmd utility.
| Code Block | ||
|---|---|---|
| ||
# we have the output from the agent. If it is ERR that means there was a problem running the script on the agent
`grep ERR $TMPFILE`
if [ $? -eq 0 ]
then
echo "Could not execute agent side script!"
# by exiting with a 2 we are forcing a CRIT service outage
exit 2
fi

# in this script we don't need to check thresholds or determine which information to check
# we just need to reformat the agent side script output slightly so that only numerical info is displayed
# we do this by trimming off the first word returned on each line from the agent, leaving just the numbers
# and printing that to screen, Uptime Infrastructure Monitor will handle the rest

awk '{print $2}' $TMPFILE

exit 0 |
...
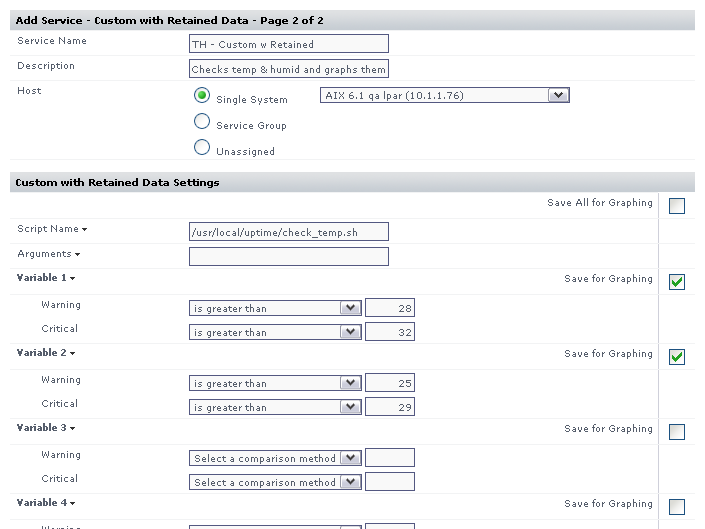
The image below illustrates a sample monitor configuration. This service monitor will indicate a WARN or CRIT whenever the monitoring station custom script returns WARNING or CRITICAL in its output.