Contents
Table of Contents
Monitoring the Network
The most critical component of any application is the network that surrounds it. To ensure that your network is available and running smoothly, we suggest monitoring the following components around your Exchange server:
- Monitor the network switches, routers and firewalls that are between your users and your Exchange services.
- Use the DNS service monitor to ensure your mail server name is resolving correctly.
- Use the PING service monitor to ensure that your mail server is responding to network requests.
Monitoring Exchange
In this section we will review the monitors that are generally recommended to fully monitor your services.
Monitoring Exchange Performance
We recommend using the service monitors listed below to monitor the internal application performance of your Exchange Server.
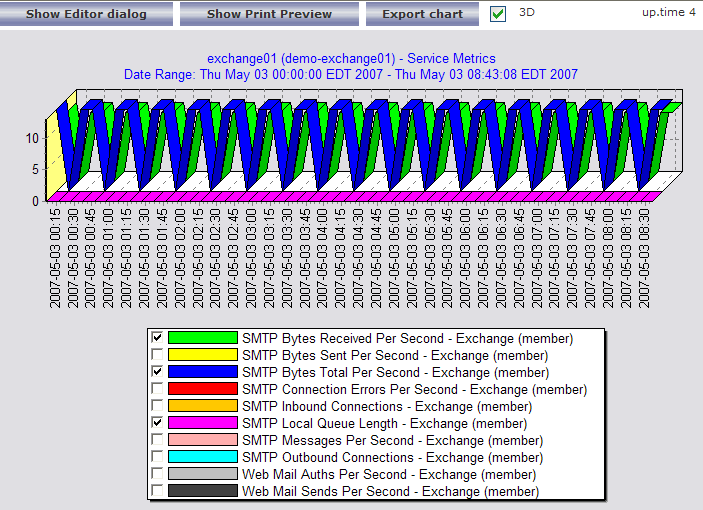
Exchange Service Monitor. The Exchange service monitor provides detailed internal performance information from your Exchange Server. We recommend adding this service to your Exchange server (note: click the Save for Graphing checkbox beside each statistic in the service monitor if you want to be able to graph or report on internal performance at a later date). Please see the Microsoft Exchange Performance Metrics article for a full list of metrics available from the Exchange service monitor. The following graph shows an example of Exchange performance statistics collected from an existing Exchange service monitor:
An example of some important Exchange Monitor settings and thresholds:
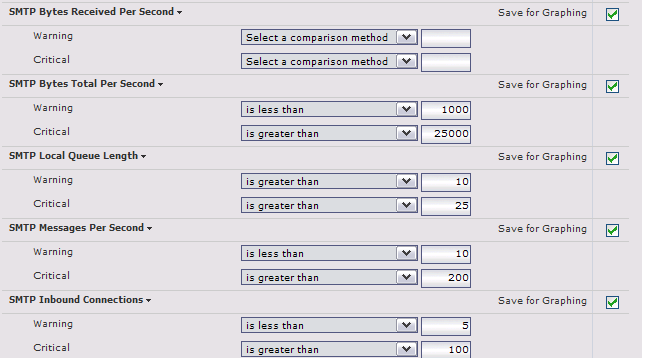
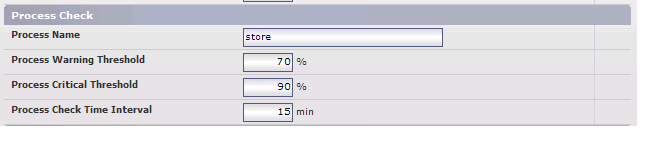
Note Many thresholds within the Exchange service monitor will depend on the size and usage of your Exchange server. We suggest enabling the Save for Graphing option on each statistic and then letting the monitor collect data for 2 to 3 days. After that time, review the collected data to see how each statistic has trended over time, and pick thresholds that seem appropriate to your installation. Performance Service Monitor. The Performance service monitor allows you to monitor the average CPU consumption of your critical Exchange processes over time. We suggest that each Exchange process have a Performance monitor dedicated to it. Each process should not consume more than an average of 70% of system CPU for a period greater than 15 minutes. Here are some example settings for the Performance service monitor:
Monitoring Exchange Services
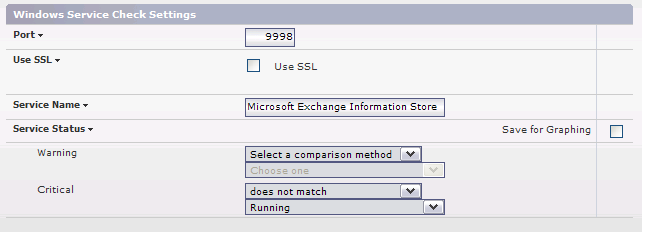
Windows Service Check Monitor. This monitor can be used to ensure that all required Exchange services are up and running on your server. In some cases you will not require all of these checks but we recommend configuring a Windows Service Check for each service named below. Each service should be in the running state.
Windows Service Name Application Microsoft Exchange Event Exchange Event Controller Microsoft Exchange IMAP4 IMAP Email Service Microsoft Exchange Information Store Primary mailbox store service Microsoft Exchange Management Exchange WMI Managemnt Interface Microsoft Exchange MTA Stacks Provides Exchange X.400 services. Microsoft Exchange POP3 Provides POP version 3 services. Microsoft Exchange Routing Engine Mail Topological Routing Information Service Microsoft Exchange Site Replication Service Replicated Mail Server Synchronization Service Microsoft Exchange System Attendant Exchange Maintenance Service An example Windows Service Check monitor for the Microsoft Exchange Information Store is provided below. We recommend creating a similar service monitor for each of the Windows services above.
...
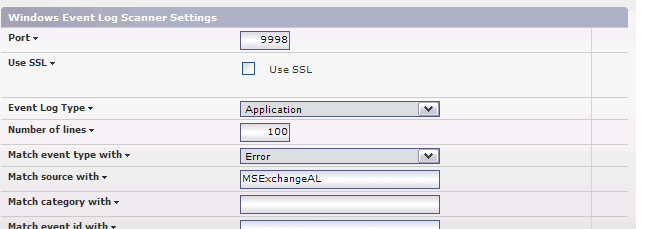
Windows Event Log Monitor. Exchange forces most error messages to the Application and System event logs. Unfortunately there are over 20 different source categories for Exchange errors. The table below indicates some of the most important event sources to monitor with the Windows Event Log monitor. We recommend configuring a monitor for each source with an event type of Error. We also suggest creating Event Log monitors for the System event log since System errors are very likely to indirectly impact your Exchange services.
Log Type Source Name Event Type Application MSExchangeAL Error Application MSExchangeIS Error Application MSExchangeSA Error Application MSExchangeTransport Error Application POP3Svc Error Here are some example settings to check for error messages from the MsExchangeAL source:
Other Monitoring Considerations
SMTP, IMAP & POP Service Checks. To ensure basic availability of each of these services, please reference How to monitor e-mail Services (IMAP, POP, SMTP) with up.time.
User Authentication. up.time includes both Active Directory and LDAP service monitors to help ensure that the central authentication server is available.
Exchange Web Mail. If your users depend on Exchange Web Mail, you should also monitor the following components:
- Monitor the Web Mail User Interface with the HTTP service monitor.
- Monitor the World Wide Web Publishing Service with the Windows Service Check monitor.
- Monitor the IIS Admin Service with the Windows Service Check monitor.
- Monitor the w3wp.exe process for performance using the Performance monitor, and availability using the Process Count monitor.
- Monitor the inetinfo.exe process for peformance using the Performance monitor, and availability using the Process Count monitor.
Monitoring the Host Server
Don't forget the value of monitoring the server that is hosting your Exchange Mail Services. Monitoring and alerting on the performance of your servers will be critical to ensure that you maintain server availability and meet capacity demands. Monitoring key performance indicators such as CPU Usage, Disk I/O, Network I/O and Memory usage is essential to ensure your servers are running properly.
Next Steps
Now that you are monitoring your Exchange Server, it is time to move on to one of these next steps:
- Report Service Outages & Availability.
- Group monitors into an Application.
- Apply monitoring templates to many systems using Service Groups.
Monitor Reference
The following service monitors were used in the monitoring example:
...