...
Web Application Transactions
| Info |
|---|
Web Transaction Monitor is Java-based and does NOT work with modern browsers. Creating new monitors has been is disabled. This monitor works only if your UIM installation already has previously-captured Web Transaction monitor recordings. This does not affect previously-configured Web Transaction Monitors. |
A Web transaction is a series of Web pages that together fulfill a specific function for end users. A common Web transaction example is the checkout process on an e-commerce site, during which end users select a shipping option, pay for their items, and have their credit card verified. During this transaction, many calls are made to the application and data layers as the end-user provides, and the servers process, information.
Although the type of Web application that is monitored by Uptime Infrastructure Monitor users is typically different (e.g., intranet applications), the structure of the transaction is the same: an end user steps through a sequence of Web pages that take inputted information and initiate appropriate actions with application or database servers.
The Uptime Infrastructure Monitor Web Application Transaction monitor tests the speed and availability of an end-user Web transaction. Specifically, the Web Application Transaction monitor performs two roles:
- it confirms the general availability of an end-user Web transaction by executing a previously recorded script then reporting whether all pages that make up the web transaction were successfully processed
- it reports on the speed of the Web transaction both as a whole, and broken down by previously defined stages
Both the availability and speed of Web transactions can be used in reports and as triggers for alerts.
Using the Web Application Transaction Monitor
Use the Web Application Transaction monitor to record a series of URLs that together make up a transaction. This recording should be of a transaction that acts as a suitable test of your Web application delivery infrastructure.
During the recording process, declare checkpoints that demarcate significant stages in the Web transaction. Isolating the different stages in an end-user transaction allows you to view stage-specific speed tests in reports, which ultimately helps you identify where problem areas exist.
For example, if a transaction relies on processing on the application layer, makes multiple calls to the data layer, and is accessible worldwide, creating checkpoints during the recording phase helps you ascertain whether the application server, database management server, or network may be the reason behind a poorly performing transaction.
The following sample checkpoints could be created for an e-commerce transaction:
- Browse Catalog
- Add to Shopping Cart
- Checkout
- Credit Card Validation
The following sample checkpoints could be created for an internal office transaction:
- Login
- Browse Orders
- View Order Details
Configuring Web Application Transaction Monitors
You can define Web application transactions by manually stepping through one and declaring checkpoints at key stages:
- Open a Web browser, and configure its proxy settings so that you can record a transaction:
- Open the dialog where network and connection settings are made.
- Configure the browser’s proxy to “localhost” on port 8001.
- Ensure these settings also are applied to SSL or secure communications.
- Set the proxy to bypass the Monitoring Station.
This step requires you to select an option such as “no proxy” or “bypass proxy server,” and may also require you to manually enter your Monitoring Station URL or IP address.
- In the browser, navigate to the starting point of the Web application whose performance you are monitoring.
In the Uptime Infrastructure Monitor Add Service window, select the Web Application Transaction monitor, then click Continue.
The Web Application Transaction Recorder is displayed, and the monitor is now listening on port 8001 for traffic.Info Ensure your browser's Java plugin is updated to the latest, most secure version.
Begin stepping through the Web transaction as an end user, providing the required data or actions.
Every URL visited during the transaction is logged and displayed in the recorder.Info The Web Application Transaction monitor records all data inputted during recording: this includes any login information. It is recommended that you use a test account for the Web application, otherwise any user data is visible in the recorded script. At each major step in the Web transaction that signals a new analysis point, enter a checkpoint name in the text box at the top of the window, then click Mark Checkpoint.
For example, create a checkpoint at a transaction step where the application takes user-inputted data and makes database calls.Info You can later set Warning and Critical thresholds that apply to every segment declared in your recording. It is recommended that the divisions between your checkpoint intervals are reasonably consistent. - Continue to repeat steps 4 and 5 until you have completed enough of the Web transaction to test it, then click Next.
Complete the monitor information fields.
To learn how to configure monitor information fields, see Monitor Identification.Info Even though the Web application performance is not directly tied to an Element’s performance, making this selection is still required: the service based on this monitor needs to be associated with an Element in order to be viewed in areas such as Global Scan or Infrastructure. - Configure the Web Application Transaction Settings:
- Script to play back
If desired, optimize the playback script (e.g., remove extraneous URLs such as image downloads). - Text that must appear
Enter a text string that can be used to confirm the script playback was successful (e.g., a phrase that appears on the final page of the application). If the monitor does not find this text, its status changes to Critical. By providing mandatory text, you can ensure an alert is triggered in cases where a Web application is malfunctioning, but checkpoint-to-checkpoint times are fast enough to fulfill response time requirements. - Text that must not appear
Enter a text string that should not appear at any point during the script playback (e.g., a client- or server-error HTTP status code). If the monitor finds this text, its status changes to Critical. Use this feature, as you would use mandatory text, to ensure a malfunctioning application triggers an alert. - User Agent String
Select the Web browser and version used to record the script. This selection determines the user agent string used in the HTTP requests to the application server, and should be provided in case the application blocks access by scripts. - Checkpoint Times
Enter the Warning and Critical Checkpoint Time thresholds. An alert is generated with these thresholds if any of the recorded Web transaction’s checkpoint times exceeds the supplied values. - Response Time
Enter the Warning and Critical Response Time thresholds. An alert is generated with this threshold if the entire transaction playback time exceeds the supplied values. For more information, see See Configuring Warning and Critical Thresholds .
- Script to play back
- Enter Warning- and Critical-level thresholds for the overall response time of the monitor.
Most of the monitor’s Response Time is comprised of the Delivery Time and the Retrieve Time. Ensure the values provided for the Response Time thresholds roughly correspond with those provided for the other thresholds. For more information, see Configuring Warning and Critical Thresholds. - Complete the following settings:
- Timing Settings (see Adding Monitor Timing Settings Information for more information)
- Alert Settings (see Monitor Alert Settings for more information)
- Monitoring Period settings (see Monitor Timing Settings for more information)
- Alert Profile settings (see Alert Profiles for more information)
- Action Profile settings (see Action Profiles for more information)
- Click Finish.
Viewing and Diagnosing Web Transaction Performance
To view Web transaction performance via playback, create a Service Metrics graph for the Web Application Transaction monitor’s system. To generate a Service Metrics graph, either select the system to which the Web Application Transaction monitor is associated in Infrastructure, or the monitor itself in the main Services panel. Click the Graphics tab, then click Service Metrics.
The Service Metrics graph shows how long each transaction segment took to complete during playback, and in doing so, provides an end-to-end performance snapshot of the components of your infrastructure that deliver applications to users. For example, the following metrics graph shows that the execution of the comments found in checkpoint3 took excessively long to complete:
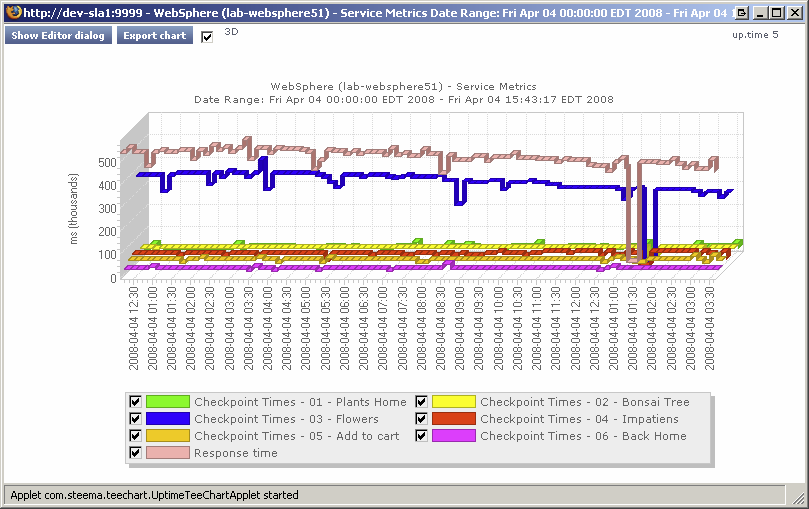
Because other checkpoints performed well, the poor performance of a single checkpoint indicates possible issues with a particular server, and not the network infrastructure. This theory can be further investigated by looking at the performance metrics for the server in question.
Use the Web Application Transaction monitor’s playback script to verify which servers are used during a problem checkpoint. In the Service Instances panel, click the monitor to view the script, then locate the system that is accessed (e.g., with GET and POST commands). Use this as an investigative starting point: although an application or Web server is often referenced in the script, the problem may be found deeper in the application stack (e.g., a database server to which the referenced Web server makes calls during the checkpoint).
Using Web Transaction Performance in SLA Reports
Your Web applications typically call on systems on the application and database tiers, as well as make use of internal- and external-facing network devices. Because the Web Application Transaction monitor directly reports on the performance of a Web transaction, it in effect indirectly reports on the health of your IT infrastructure as a whole.
This broad reporting coverage makes the Web Application Transaction monitor an ideal monitor to include in service level agreement reports.
For more information on SLA reports, see Reports for Service Level Agreements.
...