...
| Note | ||
|---|---|---|
| ||
In the first module, if you followed all three tracks, your inventory should now include a Hyper-V or VMware vCenter Server (along with its inventory of ESX hosts and VMs), a pair of physical servers (one agent-based Linux system, and a WMI-based Windows system), and an SNMP network device. The screenshots used in this module reflect this. For the exercises in this module, the two physical servers are used as examples. If you did not add physical servers to your inventory, you can either just follow along, or consider adding physical servers so that you can do every exercise. |
...
- In the left pane, click Add Service Group.
- In the Add Service Group pop-up window, confirm the group type is Regular, then click Continue.
- Give the Service Group a name. In this example, we'll call this group
pingable: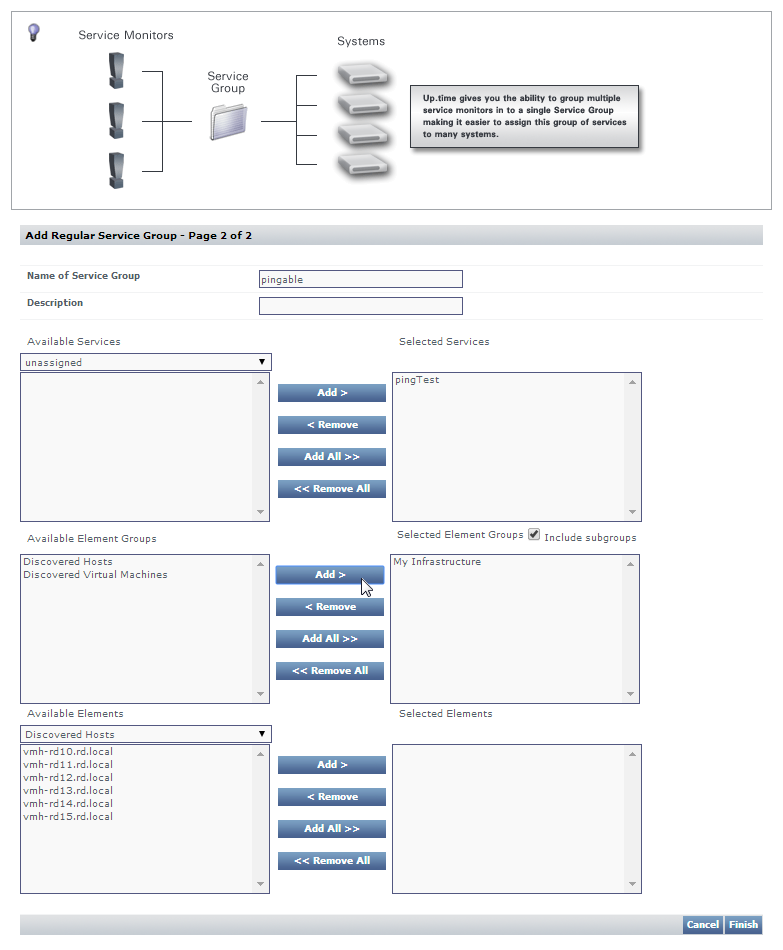
Configure the Service Group to include the pingTest service monitor you created earlier in this exercise, and associate it with the the My Infrastructure Element Group.
Note title FYI My Infrastructure is always available as an Element Group, as it represents all of your monitored inventory (or, Elements), as shown when you view it in the Infrastructure panel. The other two groups shown in this example (Discovered Hosts, and Discovered Virtual Machines) were automatically created when you add added a VMware vCenter Server as an Element.
- Click Finish, then click Close Window.
In the main UI window, you are taken to your list of Service Groups, of which you now have one: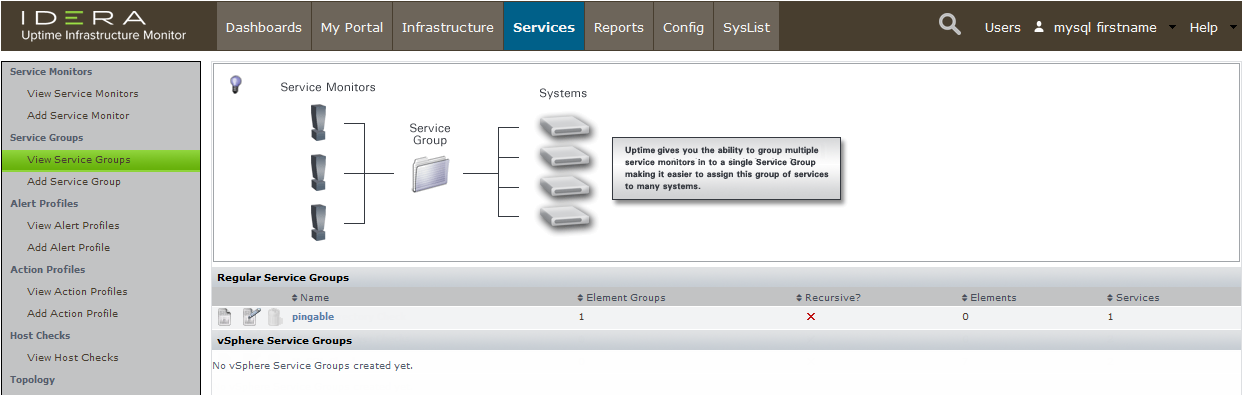
The list provides a summary of each Service Group. In our case, our group is associated with a single Element Group (and any of its subgroups); it is not directly assigned to any individual Elements; it contains a single service monitor.
...
- Click Infrastructure to view the inventory you added in the first module:.
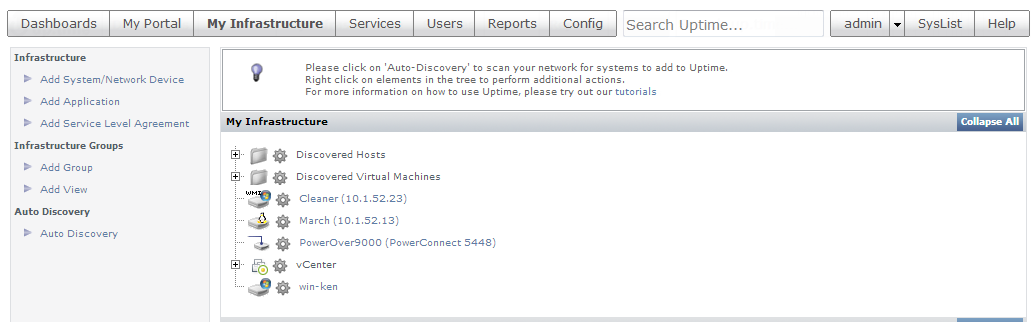 Click any Element's gear icon, then in the pop-up menu, click View to display its General Information page.
Because you have associated the Service Group to all Elements (by way of the the My Infrastructure Element Group), the service monitor is attached to any Element. - In the left pane, click the Services tab to display any services attached to, and monitoring, this Element.
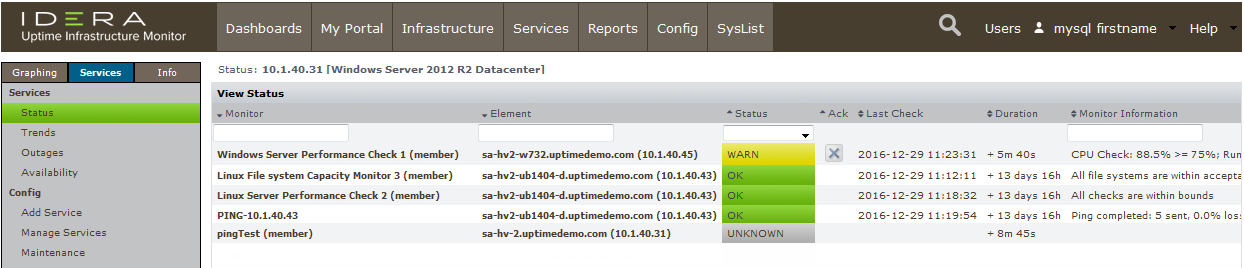
You can see that by creating a Service Group (pingable), and linking it to an Element Group to which this Element belongs (My Infrastructure), this Element now uses this service monitor. Some things to note using the above screenshot:- the pingTest service monitor has a (member) suffix to indicate it is "attached" to this Element via a Service Group, meaning the properties of this service monitor can only be edited at the Service Group level (it is possible to "detach" a service monitor to make it editable at an Element level, but this is not a best practice)
- the pingTest service monitor status may be shown as UNKNOWN because it is recently added, and a full monitoring interval has not yet passed
- to view how long a monitoring interval is for a particular Element, click its Info tab, then look in the Data Collection section of the General Information page
...
- Click Infrastructure, then click Add Group in the left pane.
Provide a Group Name of
Production, leaving the other configuration options empty, or at the default value:
- Click Save, then click Add Another.
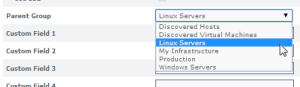
- Provide a Group Name of
Windows Servers, and make the Parent Group the previously created Production group: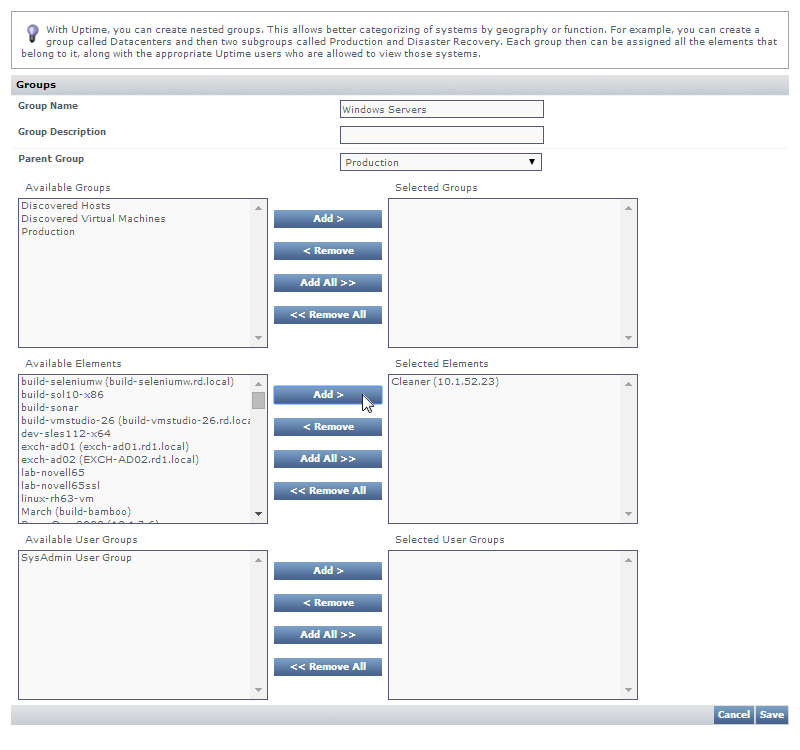
From the Available Elements list, locate and add your Windows Element.
Note title Note As mentioned at the beginning of this module, it is assumed you have Windows and Linux server Elements in your inventory. If you don't, you can either follow along, substitute these examples with something similar in your current test inventory, or go back and add these types of Elements.
- Click Save, then click Add Another.
- Provide a Group Name of
Linux Servers, and again make Production the Parent Group:
Click Save, then click Close Window.
Notice how we did not add your Linux server to the Linux Servers Element group as we were creating it. You can also assign an Element to an Element Group from the perspective of the Element itself.- In the main UI window, locate your Linux server in Infrastructure.
- Click its gear icon, then click Edit.
- In the pop-up window, change the Element's Parent Group from Infrastructure, to Linux Servers:
Click Save.
Validation (Infrastructure)
After adding the Element Groups, in the main UI window, Infrastructure is displayed. Click to expand the Production group, and the Windows Servers and Linux Servers child groups. Each of these child groups contain one Element.
...
| Info | ||
|---|---|---|
| ||
Elements are not just servers, network devices, and their virtual instances; they can also be Applications and SLAs. Although based on metrics retrieved from monitored hardware (whether physical or virtual), Applications and SLAs provide health and performance information from a business perspective. Nonetheless, they are also found under Infrastructure, and can be placed in their own Element Groups. Refer to the product documentation for more information about SLAs, and Applications and the Applications dashboard. |
Validation (Resource Scan)
Click Dashboards, then click the Resource Scan tab. This dashboard summarizes resource usage for server-type Elements from various points in your hierarchy of Elements: you can click an individual server to show its usage data, or Element Groups to show an average of all its Elements. Your Production group is here, showing an average of the data for the servers you added to its platform-specific child groups. Click the parent group to drill down and display the Windows Servers and Linux Servers child groups. Each child group now shows usage data for its respective Element. Click either child group to display its contents, which in our case is a single server that you added:
...
| Section | ||||||||||
|---|---|---|---|---|---|---|---|---|---|---|
| ||||||||||
|