Now that you have set up some sample Elements, in the coming modules, you can perform some common up.time Uptime Infrastructure Monitor tasks using these Elements. However, before continuing, let's have a quick tour of the up.time Uptime Infrastructure Monitor UI from an administrator's perspective. Specifically, take a look at the main panels, whose respective contents center around a particular function
...
- organize Elements into Element Groups to facilitate various administrator activities (for example, in one action, you can flag 30 systems as "in maintenance" to prevent alerts from generation)
- organize Elements into Views that ensure different up.time Uptime Infrastructure Monitor users can see the systems they are responsible for (for example, a View consisting of all Linux systems can be viewed by any user in the Linux administration user group; this View could have child Views that further refine the Linux systems by function, and can be viewed by more specialized Linux user groups)
- add Elements to your monitored inventory either manually, or using auto discovery (as you did in the previous module)
As the administrator, this panel is your management center for Elements. There is a complementary panel for the service monitors that are attached to to these systems, and perform the actual monitoring, data gathering, and alerting.
Services
up.time Uptime Infrastructure Monitor uses a diverse library of service monitors. Service monitors perform various roles:
- collect data from monitored Elements for graphing and reporting
- compare incoming data with configured alert thresholds
- connect to an up.time agent Uptime Infrastructure Monitor Agent to perform system-level tasks after an alert
A service monitor can be linked to an Element either directly, by manually attaching the former to the latter, or indirectly, by linking higher-level up.time Uptime Infrastructure Monitor objects such as Element Groups (which you first saw when you added a VMware vCenter Server as an Element in the previous modules) and Service Groups (which are groups of service monitors).
...
It is on this Services panel that you can create and manage any of the out-of-the-box service monitors, as well as search for additional plugin monitors found at up.time software's The Grid. You can also configure other up.time Uptime Infrastructure Monitor objects that allow you to manage monitoring-related activities:
...
The Config panel is where administrators configure the Monitoring Station. For example, in the previous module, you created global Element settings on this panel to define common configurations to communicate with the up.time agentUptime Infrastructure Monitor Agent, your WMI implementation, and SNMP network devices. Similarly, you would define how the Monitoring Station connects other platforms and applications, such as the mail server that sends alerts to users; or whether up.time Uptime Infrastructure Monitor uses your organization's LDAP server to authenticate users; or whether another up.time Uptime Infrastructure Monitor instance that offloads report generation tasks exists. It is also here that you manage the Monitoring Station's internal configuration (for example, which types of collected data are archived, or the number of Java threads are allocated to service monitors).
Users
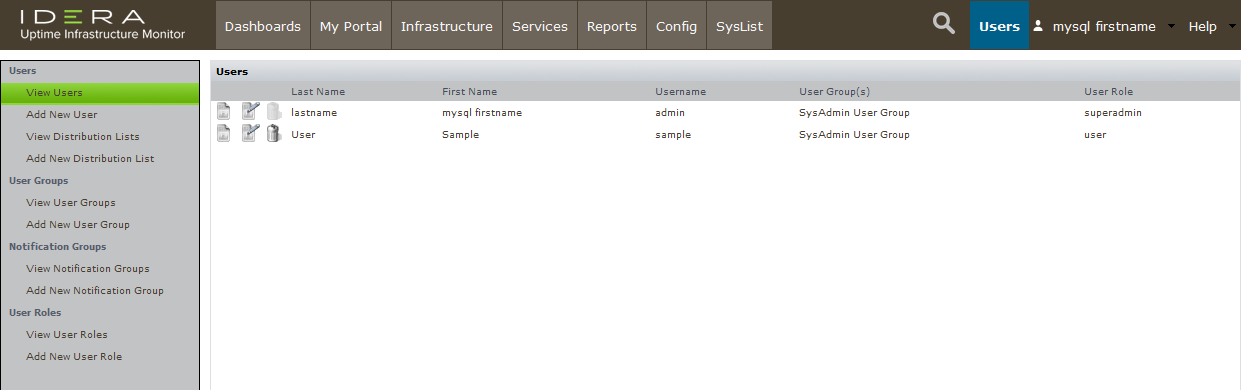
User access in up.time Uptime Infrastructure Monitor results from the properties of three overlapping constructs: user profiles, user roles, and user groups. It's on this Users panel that you can manage all of these to ensure all up.time Uptime Infrastructure Monitor users are able to see the appropriate parts of the monitored infrastructure, and perform the appropriate types of actions.
...
The contents of these panels are primarily for up.timeUptime Infrastructure Monitor's end users
The Reports panel is where users can draw on metrics stored in the up.time Uptime Infrastructure Monitor database to generate reports in real-time, or configure reports for scheduled generation and delivery to specific users and user groups (for example, weekly summary reports for managers).
...
The My Portal panel is an ideal landing page for users, as it aggregates up.time Uptime Infrastructure Monitor alerts and scheduled reports meant specifically for that logged-in user.
For most users, the Dashboards panel is the heart of up.timeUptime Infrastructure Monitor. Dashboards are templates on which collections of UI gadgets are arranged. These gadgets display historical or real-time data and render it in an interactive manner (for example, click-through for root-cause analysis).
up.time Uptime Infrastructure Monitor comes with a host of core dashboards. The following dashboard examples include the modest number of Elements you added to your monitored infrastructure in the previous module.
...
| Note | ||
|---|---|---|
| ||
Dashboards are meant to be customized. Additional gadgets are always added to up.time software's The Grid. |
| Section | ||||||||||
|---|---|---|---|---|---|---|---|---|---|---|
| ||||||||||
|