Now that you have set up some sample Elements, in the coming modules, you will be performing can perform some common up.time tasks using these Elements. However, before continuing, let's have a quick tour of the up.time UI from an administrator's perspective. Specifically, we will take a look at the main panels, whose respective contents center around a particular function
...
- organize Elements into Element Groups to facilitate various administrator activities (for example, in one action, you can flag 30 systems as "in maintenance" to prevent alerts from being generatedgeneration)
- organize Elements into Views that ensure different up.time users can see the systems they are responsible for (for example, a View consisting of all Linux systems can be viewed by any user in the Linux administration user group; this View could have child Views that further refine the Linux systems by function, and can be viewed by more specialized Linux user groups)
- add Elements to your monitored inventory either manually, or using auto discovery (as you did in the previous module)
...
- bundle a stack of service monitors into a Service Group that can be collectively assigned to Elements
- configure different types of Alert Profiles and Action Profiles that run when service monitors raise alerts
- indicate hierarchies using Topological Dependencies, to prevent a service monitor on a dependent Element from sending alerts when a parent Element's service monitor is already doing so
- avoid false positives by defining Maintenance Profiles to indicate when service monitors shouldn't watch Elements for status changes, and Monitoring Periods for when they should
You will In the next module, you work a bit with service monitors, as well as Service Groups, in the next module.
Config
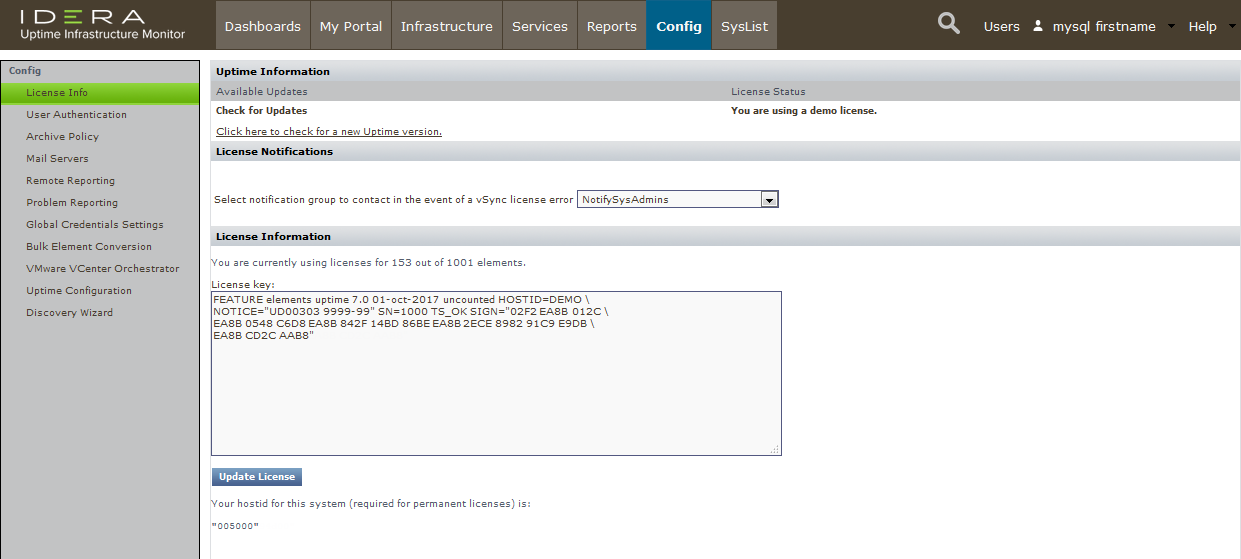
The Config panel is where administrators configure the Monitoring Station. For example, in the previous module, you created global Element settings on this panel to define common configurations to communicate with the up.time agent, your WMI implementation, and SNMP network devices. Similarly, you would define how the Monitoring Station connects other platforms and applications, such as the mail server that sends alerts to users; or whether up.time uses your organization's LDAP server to authenticate users; or whether another up.time instance that offloads report generation tasks exists. It is also here that you manage the Monitoring Station's internal configuration (for example, which types of collected data are archived, or the number of Java threads are allocated to service monitors).
...
User access in up.time results from the properties of three overlapping constructs: user profiles, user roles, and user groups. It's on this Users panel that you can manage all of these to ensure all up.time users are able to see the appropriate parts of the monitored infrastructure, and perform the appropriate types of actions.
You will In the fourth modules, you work a bit with users and user groups in the fourth module.
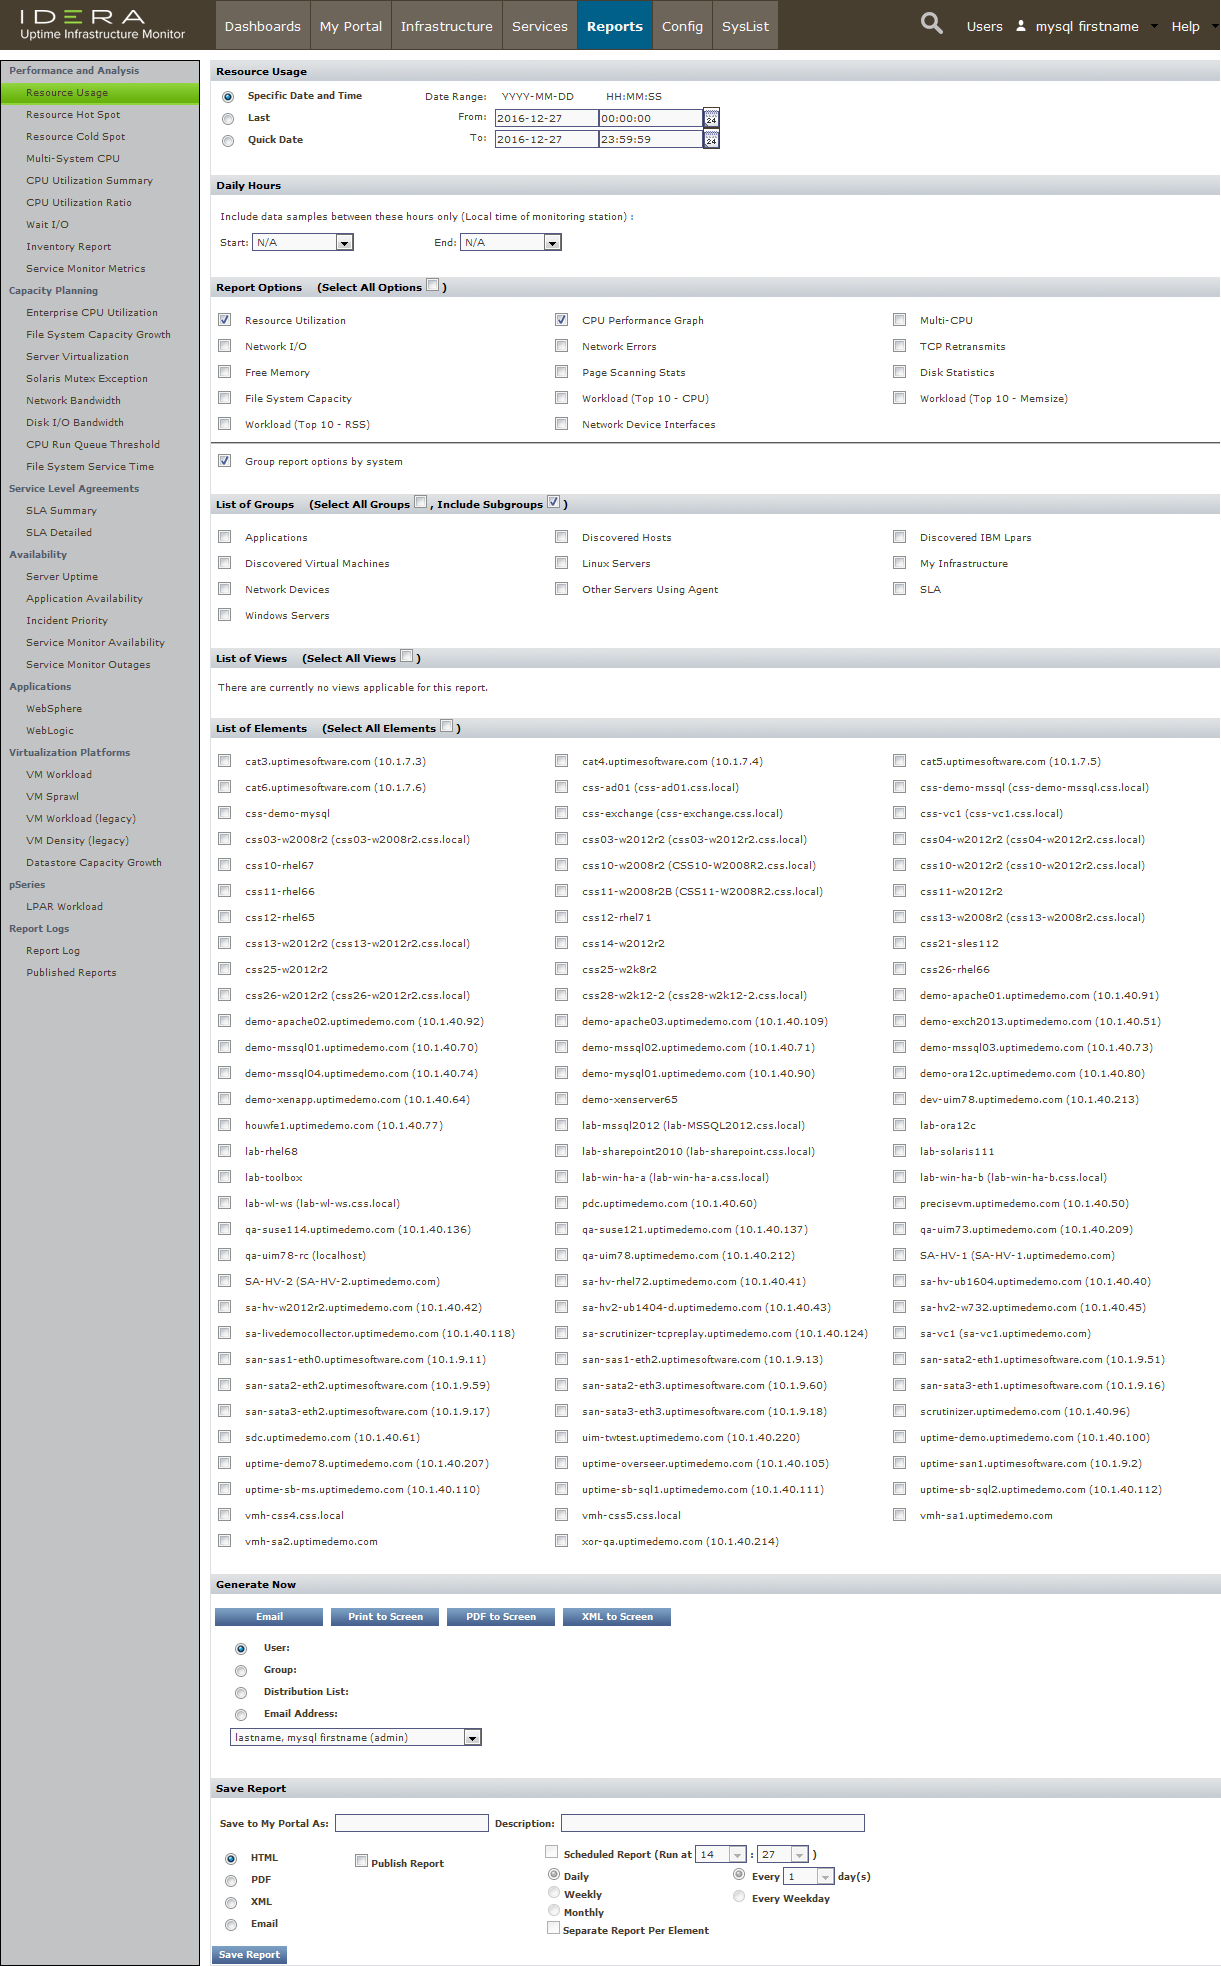
Reports, My Portal, Dashboards
...
The Reports panel is where users can draw on metrics stored in the up.time database to generate reports in real-time, or configure reports for scheduled generation and delivery to specific users and user groups (for example, weekly summary reports for managers).
You will can generate a couple of reports in the fifth module of this guide.
...
| Note | ||
|---|---|---|
| ||
Dashboards are meant to be customized. Additional gadgets are always being added to uptime software's Grid. |
...
| Section | ||||||||||
|---|---|---|---|---|---|---|---|---|---|---|
| ||||||||||
|