...
- In the up.time Web interface, begin by clicking Config, then click Global Element Settings in the left pane.
On this page are configuration fields that let you define properties of different metric collection methods, allowing you to auto discover large groups that share the same properties. - In the up.time Agent Global Configuration section, click Edit Configuration. The port used to communicate with is 9998. By default, SSL is not enabled.
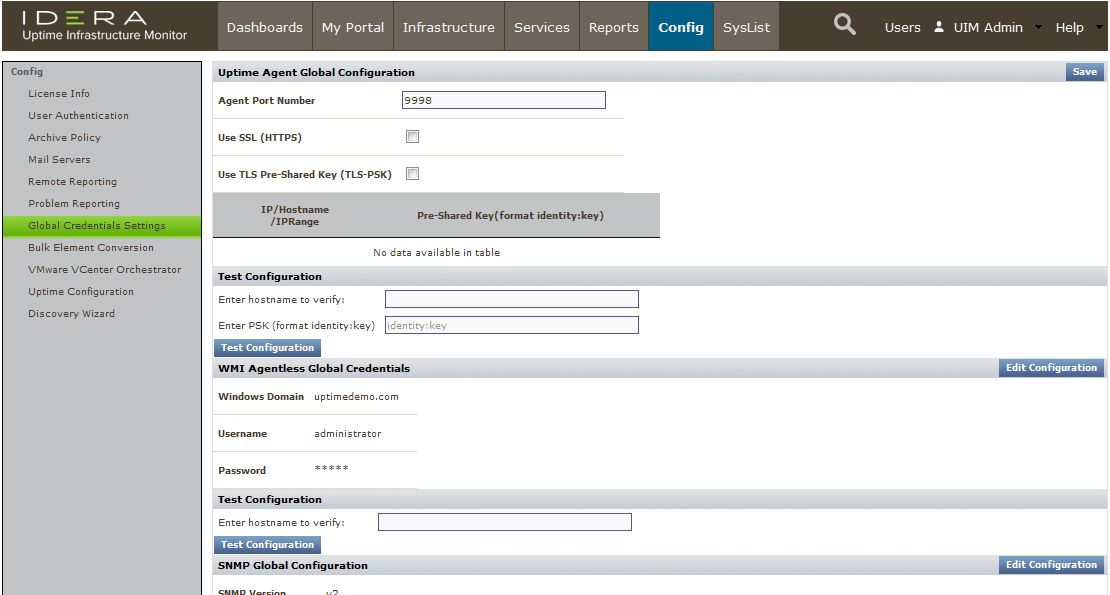
- Click Save.
Validation Step: Test the global setting by entering the hostname of the Linux server you installed the agent on during the previous exercise.
...
As with global agent settings, the WMI Agentless Global Credentials section of the Global Element Settings page lets you input WMI information once at a central point:

Configure the settings similar to those shown above:
...
- Click My Infrastructure, then click Auto Discovery in the left pane.
- In the Auto Discovery pop-up, confirm that the selection is Discover Servers and Network Devices on Your Network, and click Next.
- In the next step, select Servers with up.time Agent, and Servers with Windows Management Instrumentation (WMI). In both cases, select the Use [...] Global Configuration option that you have defined in the last two exercises:
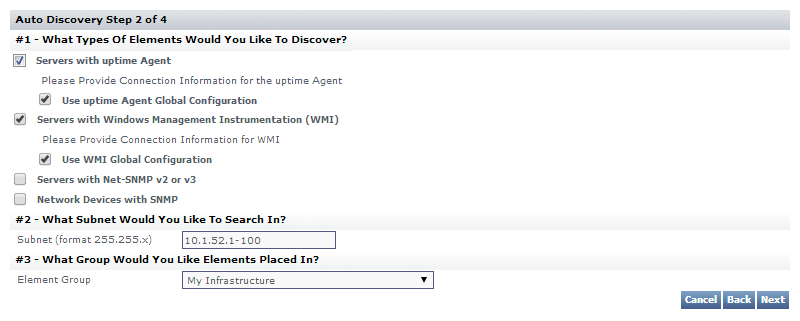
Enter the subnet or IP address range, similar to above.
Info title Pro Tip Although we are keeping things simple, and using a single subnet or IP address range as shown above, there are other ways to point up.time at subnets and subnet ranges to expedite the Auto-Discovery process. See Using Auto Discovery for more information.
Click Next to start the Auto-Discovery process.
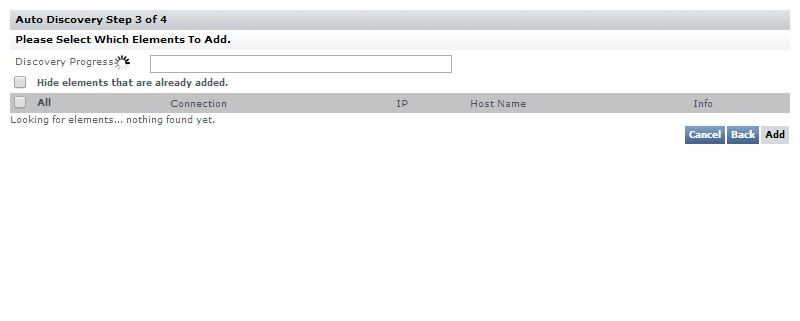
- When all servers on the subnet or IP address range have been detected you will be able to make selections to add to your up.time inventory. Select the Linux server that's using the up.time agent, and select any WMI-managed Windows server.
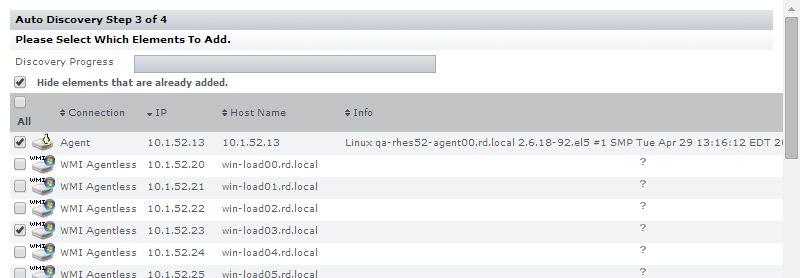
- Scroll to the bottom of the Auto Discovery list, and click Add. As a final step, you will receive confirmation that these are now part of your monitored inventory.
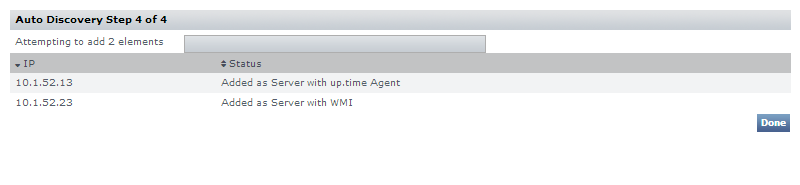
Click Done.
Review Your Current Inventory
After adding servers and closing the Auto Discovery window in the previous exercise, the main up.time UI window is at the My Infrastructure view. Refresh the page (or click My Infrastructure) to ensure the latest additions appear immediately:
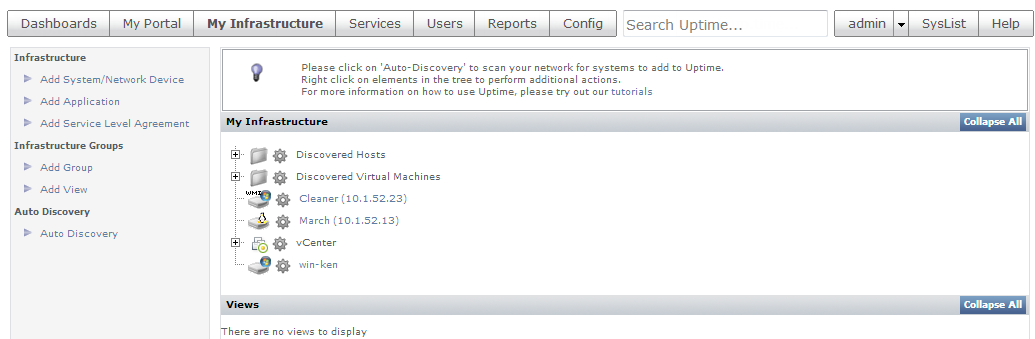
If you followed the vCenter Server track, your inventory already included the vCenter Server Element and Infrastructure Groups created over those exercises. In addition, you will now see the Linux server and WMI-managed Windows server you added in the previous exercise. Your inventory is now a mixed virtual-physical, multi-platform mix (although a small one). Also note the platform-specific icons beside each Element type.
Validation Step: Click a newly added server's gear icon. Then in the pop-up menu, click Graph Performance to go to its Quick Snapshot.
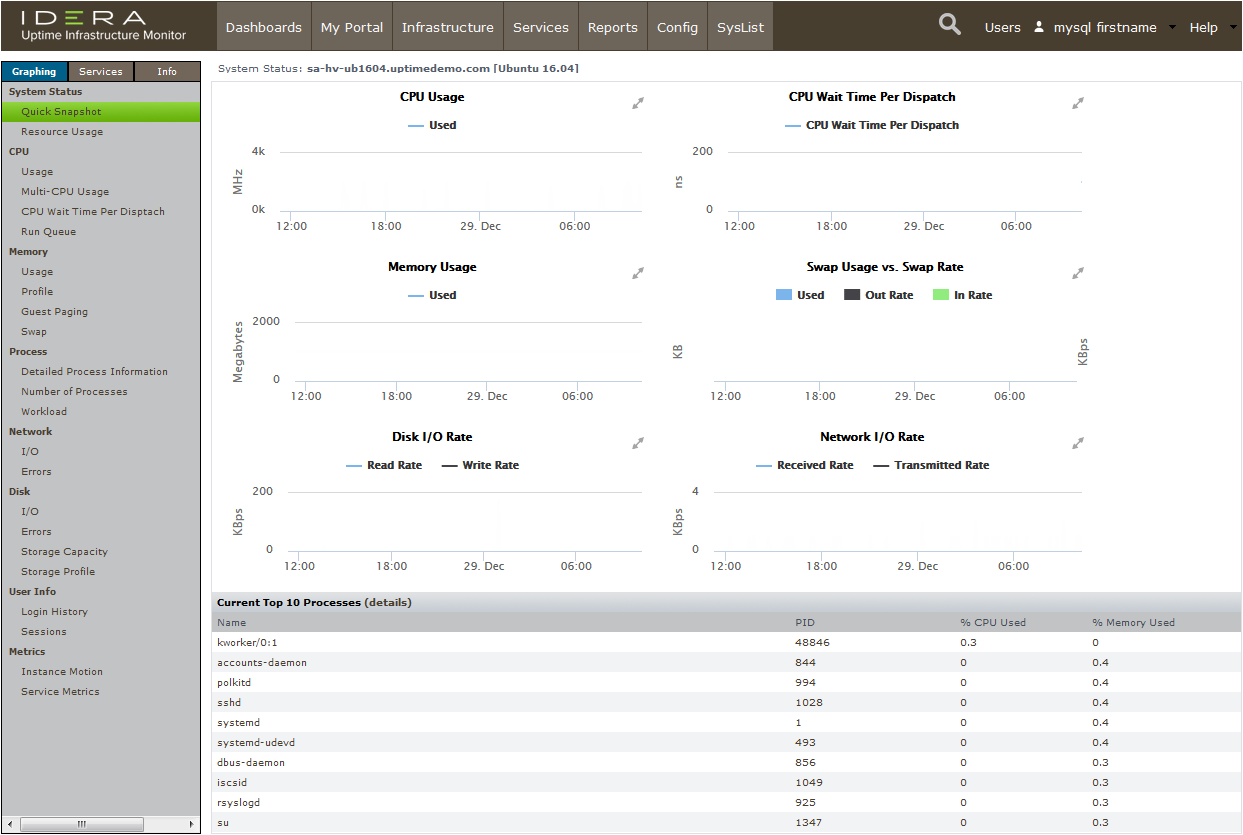
In the VMware vCenter Server track, you viewed Quick Snapshots for the vCenter Server element, and a VM-type Element. Compared to the latter, the Quick Snapshot for an agent- or WMI-based server includes more detail, such as process information, which can be acted upon by up.time (for example, up.time's action scripts can restart a service as a follow-up remedy to an outage).
...