...
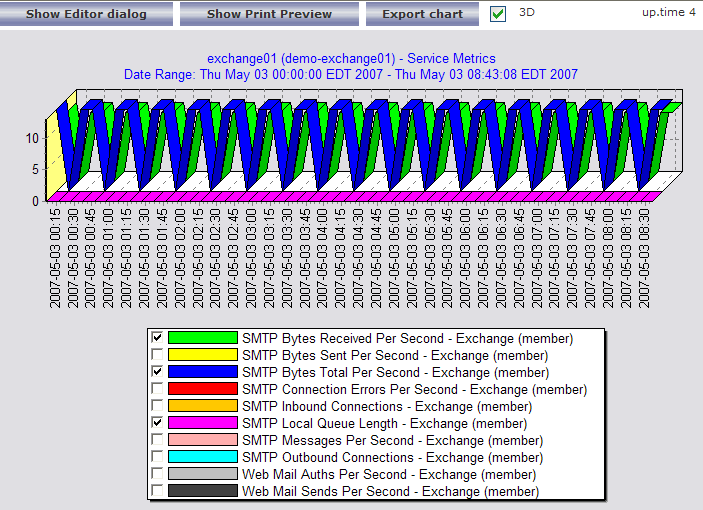
Exchange Service Monitor. The Exchange service monitor provides detailed internal performance information from your Exchange Server. We recommend adding this service to your Exchange server (note: click the Save for Graphing checkbox beside each statistic in the service monitor if you want to be able to graph or report on internal performance at a later date). Please see the Microsoft Exchange Performance Metrics article for a full list of metrics available from the Exchange service monitor. The following graph shows an example of Exchange performance statistics collected from an existing Exchange service monitor:
An example of some important Exchange Monitor settings and thresholds:
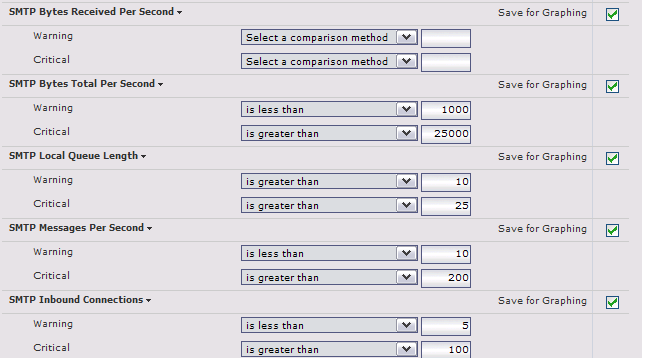
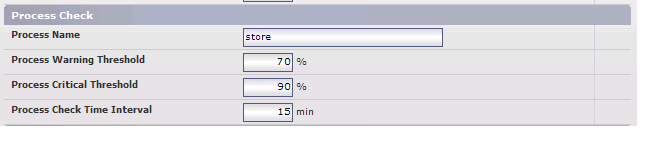
Note Many thresholds within the Exchange service monitor will depend on the size and usage of your Exchange server. We suggest enabling the Save for Graphing option on each statistic and then letting the monitor collect data for 2 to 3 days. After that time, review the collected data to see how each statistic has trended over time, and pick thresholds that seem appropriate to your installation. Performance Service Monitor. The Performance service monitor allows you to monitor the average CPU consumption of your critical Exchange processes over time. We suggest that each Exchange process have a Performance monitor dedicated to it. Each process should not consume more than an average of 70% of system CPU for a period greater than 15 minutes. Here are some example settings for the Performance service monitor:
...