...
- Internet Information Server (IIS) with ASP.NET
- SQL Server
- Visual Studio .NET
Please also refer to Running up.time on MS SQL Server.
...
Setting up a Database Connection
...
- In Microsoft Visual Studio .NET, right-click Reports and choose Add New Report.
The Report Wizard starts.
- Click Next.
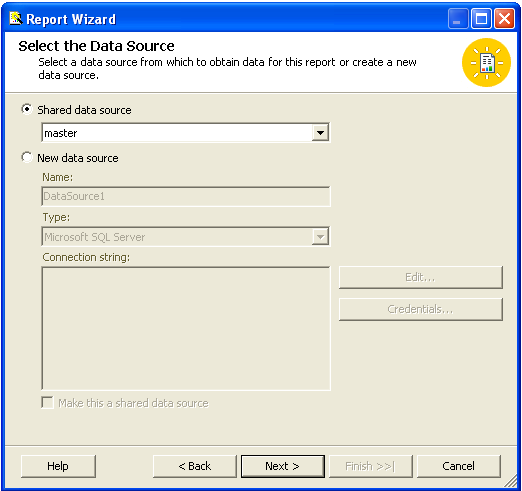
- Select Shared data source and then select the database from which you are retrieving data.
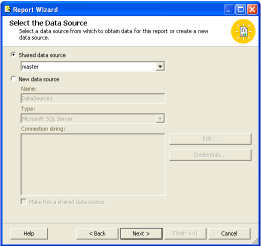
- Click Next.
Enter the following query string:
Code Block language sql SELECT e.display_name AS 'Description', AVG(p.cpu_usr + p.cpu_sys + p.cpu_wio)
AS 'CPU Workload Average',(CONVERT(char(10),s.sample_time,102)) AS 'Date'FROM performance_sample s,
eperformance_aggregate p, entity
ide WHERE s.id = p.sample_
idid AND e.entity_id = s.uptimehost_
2006id AND s.sample_time > '
20062013.11.29' AND s.sample_time < DATEADD(day,5,'
name2013.11.29') GROUP BY (convert(char(10),s.sample_time,102)), e.display_
name
ORDER BY (convert(char(10),s.sample_time,102)), e.display_name;
This example will report on the CPU workload average for all systems over the five day period from 2006-11-29 to 2006-12-03 (simply change the dates or the interval as required).
- Click Next after you change the range to suit your needs.
- Choose the Matrix option and then click Next.
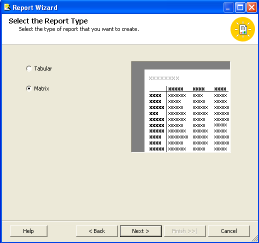
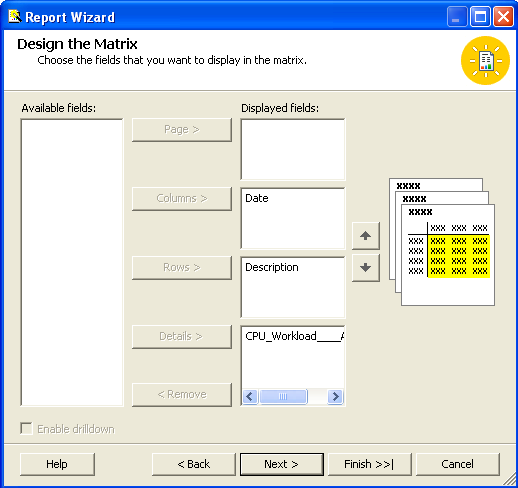
The Design the Matrix window appears, which enables you to change the way in which data is arranged in the report.
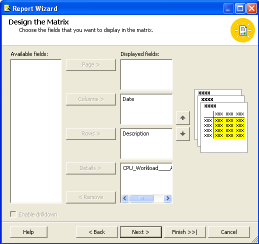
In this example:
- Description is moved to the Rows field.
- Date is moved to the Columns field.
- CPU Workload Average is moved to the Details field.
- Click Next.
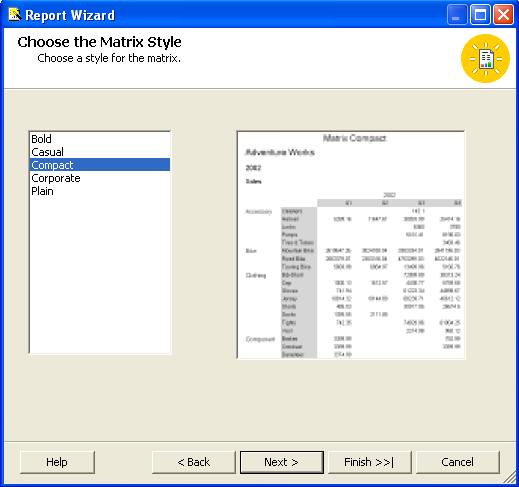
- In the Choose Matrix Style window, select Compact.
The Design the Matrix window appears.

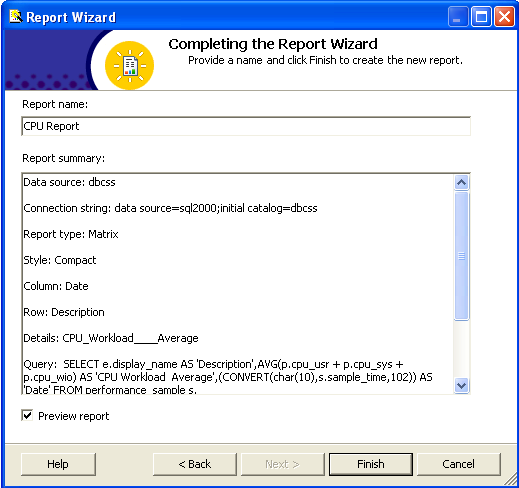
- Select to display all of the fields in the report and then click Next.
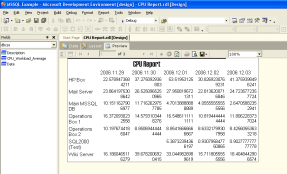
- Click the Preview Report check box at the bottom of the page.

- Click Finish to generate a preview of the report.


...
| Note | ||
|---|---|---|
| ||
Published reports may not render properly in web browsers other than Internet Explorer. If, for example, you have set your default browser to Firefox and the report does not open properly after you have published it, copy and paste the URL of the report into Internet Explorer. You can also view the report by navigating to the Report Manager URL in Internet Explorer. By default, the URL is http://localhost/Reports/Pages/Folder.aspx. |