Contents
Overview
The purpose of this article is to outline steps to easily deploy a trap listener in your infrastructure to drive SNMP trap alerts into Uptime Infrastructure Monitor. Although the article utilizes snmptrapd provided by Net-SNMP to receive SNMP traps and execute scripts, one can use any SNMP trap receiver as long as it can execute scripts when traps are received. The steps provided in this article were applied to a Windows server. Identical steps can be applied to a Linux server running Uptime Infrastructure Monitor. Contact Uptime Support at [email protected] if you have any issues.
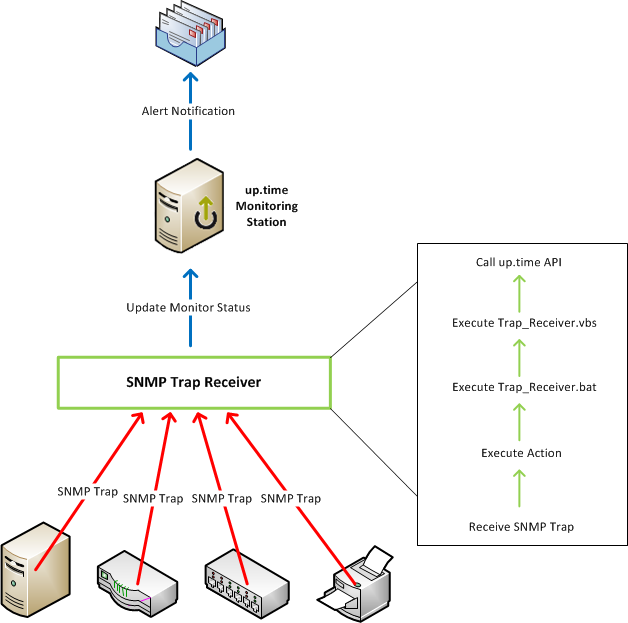
Net-SNMP is an SNMP application suite supported on numerous platforms including Windows and Linux (the two platforms the Uptime Infrastructure Monitor Monitoring Station is supported on). Here is a brief summary of what happens when an SNMP trap is sent:
- the SNMP-enabled device sends an SNMP trap to the snmptrapd service
- snmptrapd compares the trap to the list of filters in the snmptrapd.conf file
- when the trap matches the uptime filter, the trap_to_ext_event.pl perl script is executed
- trap_to_ext_event.pl calls the Uptime Infrastructure Monitor API to update the status of the External Check monitor associated with the device
- if an Alert Profile is associated with the monitor, an alert notification is sent out
Below is a diagram depicting the process:
Install Net-SNMP and Perl
- Download Net-SNMP from http://sourceforge.net/projects/net-snmp/files/net-snmp%20binaries/5.6.1.1-binaries/net-snmp-5.6.1.1-1.x86.exe/download
- Download Strawberry Perl from http://strawberryperl.com/download/5.20.1.1/strawberry-perl-5.20.1.1-64bit.msi
- Execute the Net-SNMP installer and accept the defaults.
- Execute the Strawberry Perl installer and accept the defaults
Create a snmptrapd configuration file and Perl script
create a new file called snmptrapd.conf in the C:\usr\etc\snmp directory with contents similar to the following ("public" on the first line is the SNMP community string - feel free to changed accordingly, and the path to Uptime Infrastructure Monitor on the second line should be changed accordingly):
authCommunity log,execute,net public
traphandle default C:\Strawberry\perl\bin\perl.exe "C:\Program Files\uptime software\uptime\scripts\snmp-trap-script\trap_to_ext_event.pl"
- in the Start menu, select the Net-SNMP folder, right click Register Trap Service and choose Run As Administrator
- start the "Net-SNMP Trap Handler" service
- create the directory "C:\Program Files\uptime software\uptime\scripts\snmp-trap-script"
- download and copy this file, trap_to_ext_event.pl, to the directory mentioned in the previous step
This approach assumes that your SNMP trap service monitors all have the same name, "SNMP Trap (member)", and are managed via a Service Group.
There are two logs that are created with this solution, one when traps are received by the Net-SNMP Trap Handler service and another when the trap is sent into Uptime Infrastructure Monitor by the perl script. This helps to narrow down an issue if one arises.
Uptime Infrastructure Monitor Configuration
Create a new monitor called "SNMP Trap" and assign it to a Service Group, so that it can be applied to numerous Elements in Uptime Infrastructure Monitor.
- Create a Service Group for your devices that will send SNMP traps to Uptime Infrastructure Monitor.
- Click on the “Services” button at the top
- Click the "Add Service Group" link in the menu on the left
- Select "Regular" from the drop down and click the "Continue..." button
- Enter "SNMP Trap Group" as the name for the Service Group and, optionally, a description for the group
- In the "Available Element Groups" and "Available Elements" lists, choose the Element Groups and Elements that you want to have SNMP Trap monitors created for
- Click the "Finish" button and close the dialogue window
- Create an External Check monitor and assign it to the "SNMP Trap Group" Service Group.
- Click on the “Services” button at the top
- Click “Add Service Monitor” on the left
- Select “External Check” from the list of available Service Monitors and click “Continue…”
- Input “SNMP Trap” as the Service Name
- Select the "Service Group" radio button and choose "SNMP Trap Group" from the drop down.
- Choose an Alert Profile to have alert messages sent to the appropriate users.
- Click “Finish”
Now when traps are received by the Net-SNMP snmptrapd service, the appropriate "SNMP Trap (member)" service monitor will be set to CRIT and an alert will be sent out. When the status is acknowledged in the Uptime Infrastructure Monitor UI (click the ACK button), the status will be set back to OK.